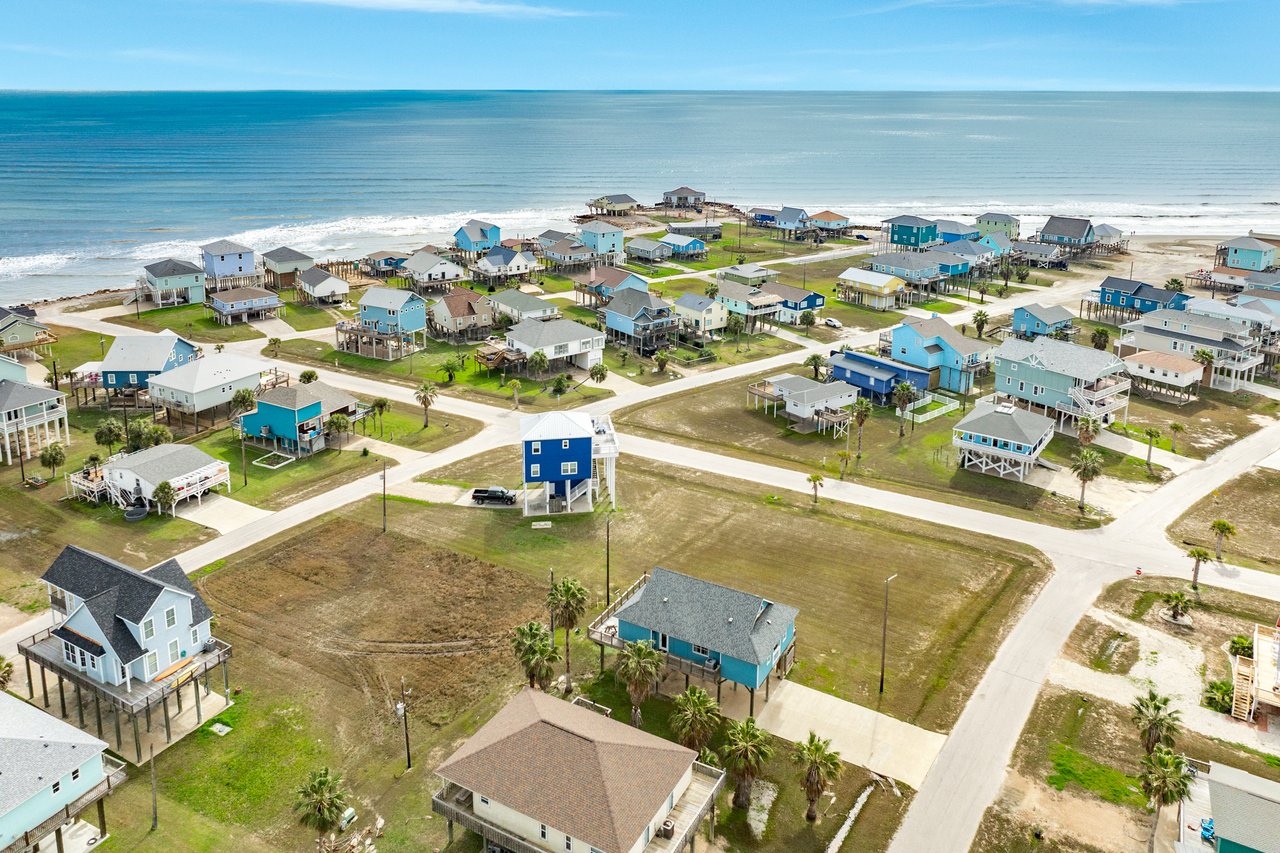
August 2025 Island Market Report: Surfside Beach, Treasure Island & Bridge Harbor
Welcome to your monthly update on the island real estate market! At Carter Signature Properties, we track every detail so our sellers and buyers stay informed about trends, pricing, and buyer activity. Here’s what we saw in August across Surfside Beach, Treasure Island, Bridge Harbor, and the island’s land market.
Island-Wide Overview
There are currently 236 active listings on the island. In August, 5 homes are under contract with an average list price of $485,560 and an average of 330 days on the market. 3 homes sold this month with an average sales price of $339,833 and remarkably, just 18 days on the market.
Treasure Island
Treasure Island had 45 active listings with an average list price of $542,424 and an average of 351 days on the market. Only 1 home is pending this month and no homes sold in August. Showing activity has been limited, with 9 showings across 7 listings.
Surfside Beach
Surfside Beach shows strong buyer interest in certain price ranges. There are 149 active listings averaging $494,421 and 286 days on the market. Currently, 4 homes are pending with an average list price of $418,475 and an unusually high average DOM of 510 days. Two homes sold in August with an average sales price of $309,750 and an average DOM of just 18 days.
Surfside Beach Showing Report – August
| Price Range | Showing Count | Listing Count | Average Showings per Listing |
|---|---|---|---|
| $100,000–$199,999 | 5 | 3 | 1.67 |
| $200,000–$299,999 | 8 | 7 | 1.14 |
| $300,000–$399,999 | 16 | 12 | 1.33 |
| $400,000–$499,999 | 12 | 8 | 1.50 |
| $500,000–$599,999 | 10 | 7 | 1.43 |
| $600,000–$699,999 | 10 | 8 | 1.25 |
| $700,000–$799,999 | 3 | 2 | 1.50 |
| $800,000–$899,999 | 2 | 2 | 1.00 |
| $900,000–$999,999 | 0 | 0 | 0 |
| $1,000,000–$1,100,000 | 0 | 0 | 0 |
Bridge Harbor
Bridge Harbor had 1 home close in August, 1 home pending, and currently has 3 homes for sale. Buyer activity remains modest but consistent for this niche market.
Island Land Market
Island lots continue to attract investors and buyers seeking development opportunities. Currently, 121 lots are for sale with an average list price of $277,304 and an average DOM of 310 days. In August, 1 lot sold and 3 lots are pending with an average list price of $130,963 and an average DOM of 44 days.
Key Takeaways
- Price is the primary driver: Buyers are very price-conscious. Homes and lots priced for value are generating activity quickly, while higher-priced listings see limited showings.
- Inventory is high: With 236 homes and 121 lots active on the island, sellers need competitive pricing and smart marketing to stand out.
- Exposure matters: At Carter Signature Properties, even if you list with a specific agent, our full team of 5 island agents actively promotes your property, maximizing visibility and buyer reach.
Whether you’re looking to sell or are just curious about your home’s value, staying informed is key. For a personalized market analysis or to discuss how to position your property for the fastest sale, contact Carter Signature Properties today.