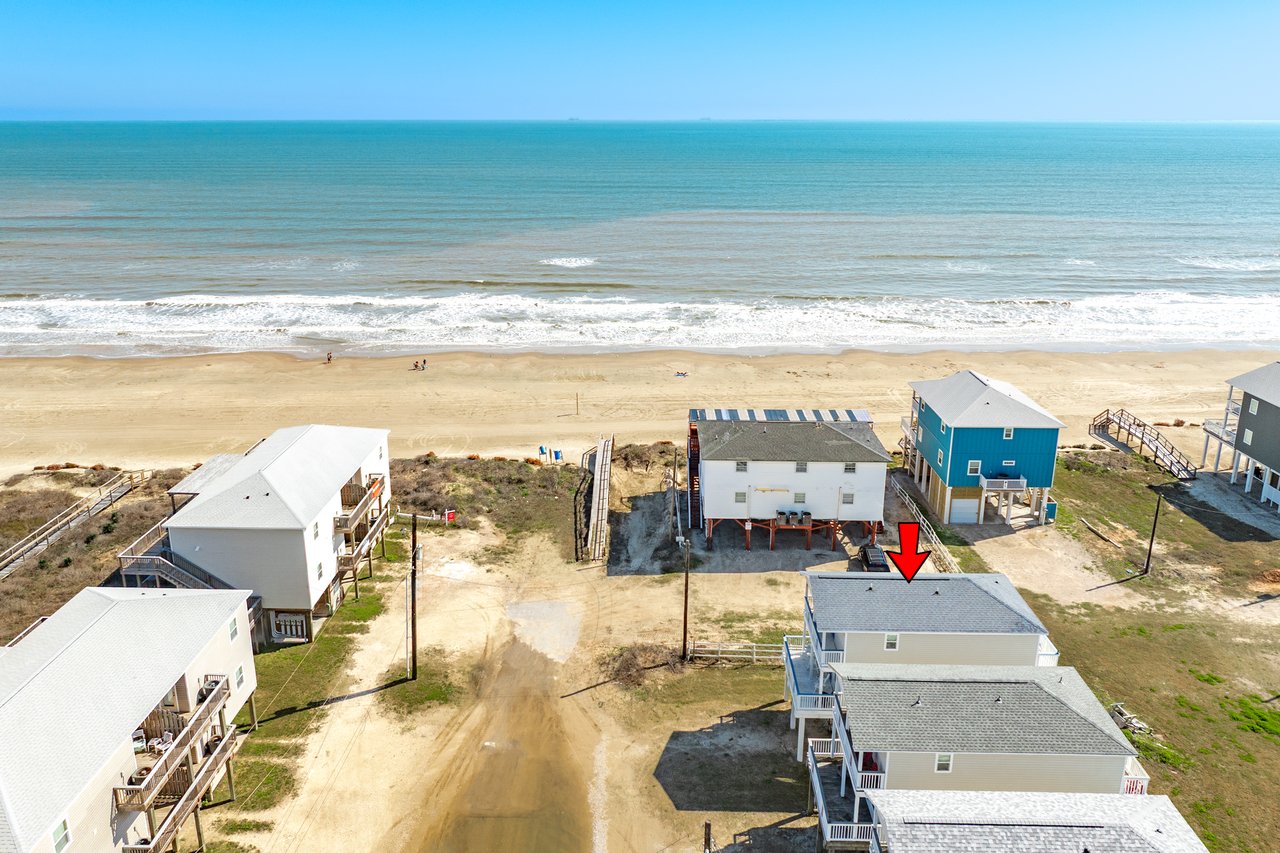
How are homes selling in Surfside Beach and Treasure Island in May 2026?
In May 2026, Surfside Beach and Treasure Island recorded 7 single family home closings across 230 active listings, with an average sale price of $341,471. The homes that sold were priced where buyers are shopping. The homes still sitting are priced too high in the eyes of the buyer. In a buyer's market with this much inventory, pricing isn't negotiable — it's the deal.
The May 2026 Island Market: What the Data Shows
Here's the picture: 230 active homes. 7 closings. 12 pending contracts. For every home that closed in May, 33 others are still waiting. With that many options available, buyers aren't flexible — they're shopping. They're comparing. And they're walking away from anything that doesn't match their perception of value.
Surfside Beach led market activity with 146 active homes and 167 showings recorded in May. Treasure Island had 84 active homes and 27 showings. Both areas saw buyer traffic, but traffic isn't the same as velocity. Homes in the right price range moved. Homes above the buyer's comfort zone are still sitting with a sign in the yard.
According to the National Association of Realtors, buyer behavior in high-inventory markets shifts dramatically — buyers become far more selective, and overpriced homes simply don't compete regardless of their features or condition.
In a Buyer's Market — Price is Driving This Market
With 230 active single family homes on the market and 7 May sales, pricing strategy is everything. Homes selling are priced right. Homes sitting are priced high in the eyes of the buyer.
May's data is clear: buyers are selective. Smart pricing wins. Unrealistic pricing loses.
Surfside Beach: Entry-Level Buyers Are Active
Surfside Beach is where the volume is. In May, 167 showings across 89 properties tell you exactly where buyer focus lives: the $120,000 to $319,000 range. Homes in this segment averaged 2.5+ showings per listing. Homes above $420,000 averaged less than 1.7 showings per listing.
What Sold in Surfside Beach — May 2026
Two homes closed in May:
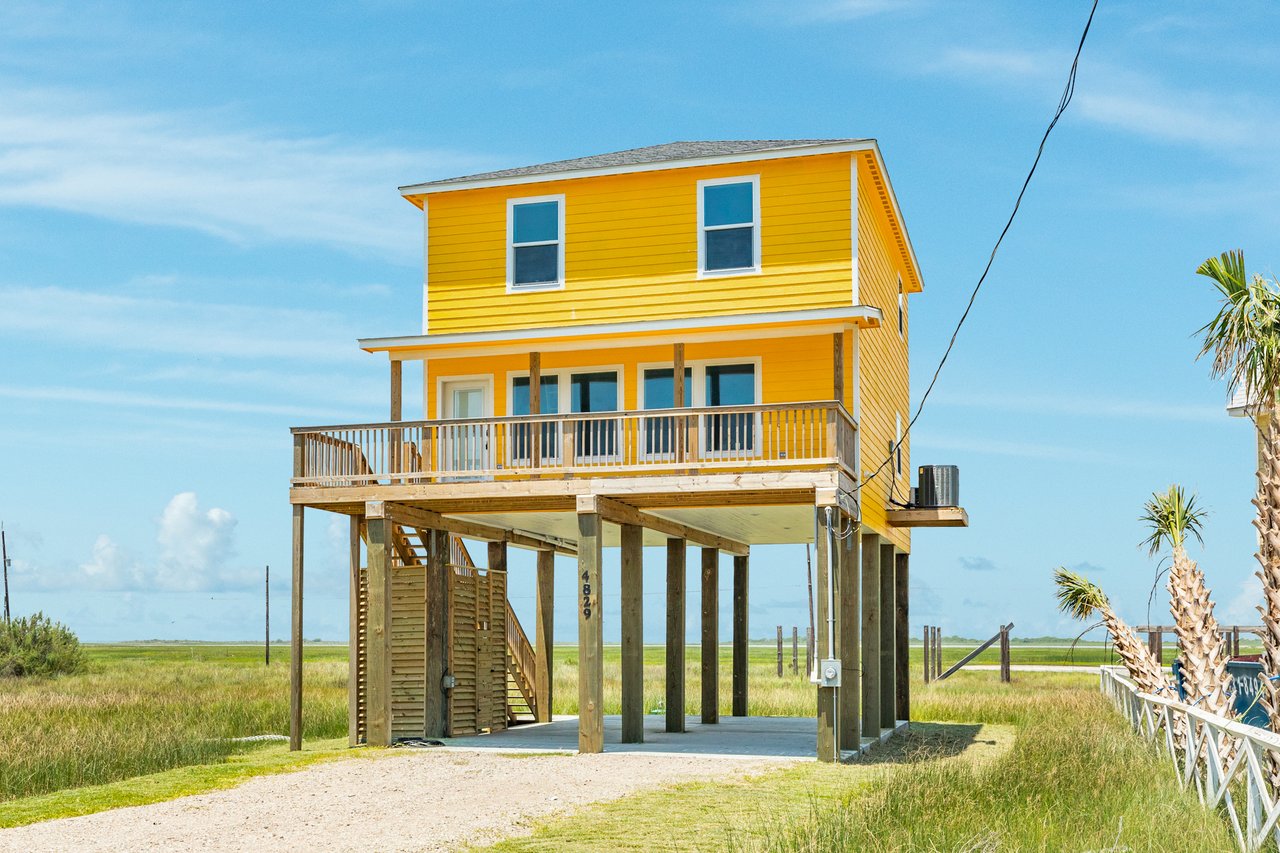
• $107,000 — 605 Texas Street | Closed May 14
• $315,000 — 426 Shark | Closed May 1
Both were priced to clear the market. Both sold.
The 146 homes still sitting in Surfside Beach? Look at their pricing. Odds are strong they're positioned above what buyers currently want to pay — and with 146 options available, buyers have no reason to stretch.
Surfside Beach Showing Activity by Price Range
The showing data tells the story clearly. The $220K-$319K segment had 49 showings across 22 listings — the highest total showing count in Surfside. Entry-level homes ($120K-$219K) averaged 3.44 showings per listing — the highest engagement of any price range on the island.
May 2026 Surfside Beach Showings — By Price Range
• $120K–$219K | 31 showings / 9 listings | 3.44 avg per listing
• $220K–$319K | 49 showings / 22 listings | 2.23 avg per listing
• $320K–$419K | 25 showings / 20 listings | 1.25 avg per listing
• $420K–$519K | 35 showings / 21 listings | 1.67 avg per listing
• $520K–$619K | 18 showings / 10 listings | 1.80 avg per listing
• $620K+ | 9 showings / 7 listings | 1.29 avg per listing
Island average: 1.88 showings per listing. Total Surfside showings: 167.
Treasure Island: Premium Buyers, Selective Traffic
Treasure Island's market runs quieter. 27 showings across 84 homes in May. But those showings concentrated in the $420,000 to $619,000 range — the island's premium segment. Five homes closed in May with an average sale price of $393,660. The highest sale came in at $590,000. That's not entry-level buyer activity. That's selective, intentional purchasing.
What Sold in Treasure Island — May 2026
• $229,900 — 13114 Coronado | Closed May 15
• $357,500 — 13214 Jolly Roger | Closed May 27
• $390,000 — 13130 Gulf Beach | Closed May 11
• $400,900 — 307 Anchor | Closed May 28
• $590,000 — 206 China Clipper | Closed May 22
Average sale price: $393,660 | 12 pending contracts island-wide averaging $326,367
Treasure Island Showing Activity by Price Range
May 2026 Treasure Island Showings — By Price Range
• $220K–$319K | 2 showings / 2 listings | 1.00 avg per listing
• $320K–$419K | 6 showings / 4 listings | 1.50 avg per listing
• $420K–$519K | 11 showings / 7 listings | 1.57 avg per listing
• $520K–$619K | 5 showings / 3 listings | 1.67 avg per listing
• $620K+ | 3 showings / 3 listings | 1.00 avg per listing
Total Treasure Island showings: 27 | Average: 1.42 per listing
Treasure Island homes move differently than Surfside Beach. Fewer showings — but higher purchase velocity. If you're selling a Treasure Island property, your buyer pool is smaller but more intentional. Price correctly for the $420K-$620K segment and buyers show up.
Resort Properties: Your Availability is Part of Your Competitive Position
Here's what doesn't get talked about enough in resort markets: with 230 homes competing for buyer attention, your home's availability is a pricing factor.
Buyers on the Island Are Not Rescheduling
If your home can't be shown — maintenance issues, owner scheduling, staging delays, STR bookings blocking access — buyers are not waiting around. They move to the next listing. Unless your property is priced so far below market that it's a steal, they will not reschedule.
In a market with too many options, every missed showing is a lost opportunity.
Think about it from the buyer's perspective: You're shopping Surfside Beach homes in the $250,000 range. One property has a "call ahead" note. Another says "owner available weekends only." Three others are available to show today. Which one gets the appointment?
Availability is competitive positioning. Price drives sales. Availability drives interest. In a buyer's market with 230 active listings, you need both working for you — not against you. The Texas A&M Real Estate Center consistently shows that showing volume and accessibility are among the strongest predictors of time-to-contract in high-inventory coastal markets.
Three Questions Every Island Seller Should Ask Right Now
If your Surfside Beach or Treasure Island home is currently on the market, be honest with yourself about these:
Vacant Lots: A Niche Market with Slow Velocity
If you own a vacant lot on the island, understand the dynamics: 116 active lots. 5 May sales. 476 days average on market. Zero pending contracts. Land moves slowly here and serves a specific buyer profile — developers, builders, long-term hold investors. Unless your lot is priced aggressively for that audience, it will sit. According to Brazoria County Appraisal District data, lot valuations have remained relatively flat, reinforcing that land is a patient play in this market.
The Bottom Line
In May 2026, with 230 Surfside Beach and Treasure Island homes competing for buyer attention, you have two choices: price your home where buyers are shopping, or watch it sit while other homes sell.
Smart pricing wins. Unrealistic pricing loses. That's not opinion — that's the May 2026 data.
Frequently Asked Questions
Seven homes closed across Surfside Beach and Treasure Island in May 2026, averaging $341,471. Surfside Beach specifically saw two closings at $107,000 and $315,000. Treasure Island had five closings ranging from $229,900 to $590,000 with an average of $393,660. Pricing, location, and condition all impact where an individual home lands within that range.
Active Surfside Beach single family homes average 345 days on market as of May 2026. However, homes priced in the $120K-$320K range move considerably faster than that average. Days on market is more a function of pricing strategy than market conditions — homes priced right sell; homes priced high sit.
Yes — with context. May 2026 data shows strong showing activity in the $420K-$620K segment, and five homes closed at an average of $393,660. Treasure Island attracts a smaller but more intentional buyer pool than Surfside Beach. If you're buying in the premium segment, the market is active. If you're price-shopping, Surfside Beach offers more entry-level inventory and buyer activity.
Ready to Price Your Home Right?
Cathy Carter, Broker at Carter Signature Properties, analyzes local market data every month to help island sellers position their homes where they sell — not where they sit.
Call (972) 358-6420Experience the Signature Difference
Data compiled from MLS for May 2026, Surfside Beach and Treasure Island, Brazoria and Galveston Counties, TX. Single family home showing data from ShowingTime for the period of May 1–31, 2026. All information believed accurate but not guaranteed. This post is for informational purposes only. Equal Housing Opportunity. © 2026 Carter Signature Properties.