November 2025 Market Insights
If you're buying or selling coastal property in Surfside Beach or Treasure Island, you need to know what November's market data is telling us. Spoiler alert: it's a buyer's market, and the numbers don't lie. Let's break down exactly what happened in November 2025 and what it means for your next move.
Market Snapshot: The Numbers That Matter
- 211 - Active Listings
- $455K - Median Active Price
- 339 - Avg Days on Market
- 6 - Homes Sold/Closed in December ($316,525 Avg Sales Price)
With 211 active listings and only 6 homes sold in the past 30 days, we're looking at a classic buyer's market. Properties are sitting an average of 339 days—that's nearly a full year. If you're a seller, this isn't the time for wishful pricing. If you're a buyer, you've got leverage.
The Brutal Truth: What This Market Demands
🏖️ For Sellers: Price or Sit
Here's the reality check: with 35x more active listings than recent sales, your competition isn't other sellers—it's buyer indifference. The market has zero patience for what buyer's view as overpricing right now. Properties priced competitively get showings. Everything else collects dust.
🎯 For Buyers: You're in Control
High inventory plus extended days on market equals serious negotiating power. Don't be afraid to make offers below asking price. Sellers are motivated, and the data proves buyers are being selective. Use that to your advantage.
Where Buyers Are Actually Shopping
Not all price ranges are created equal in this market. Here's where the action is (and isn't):
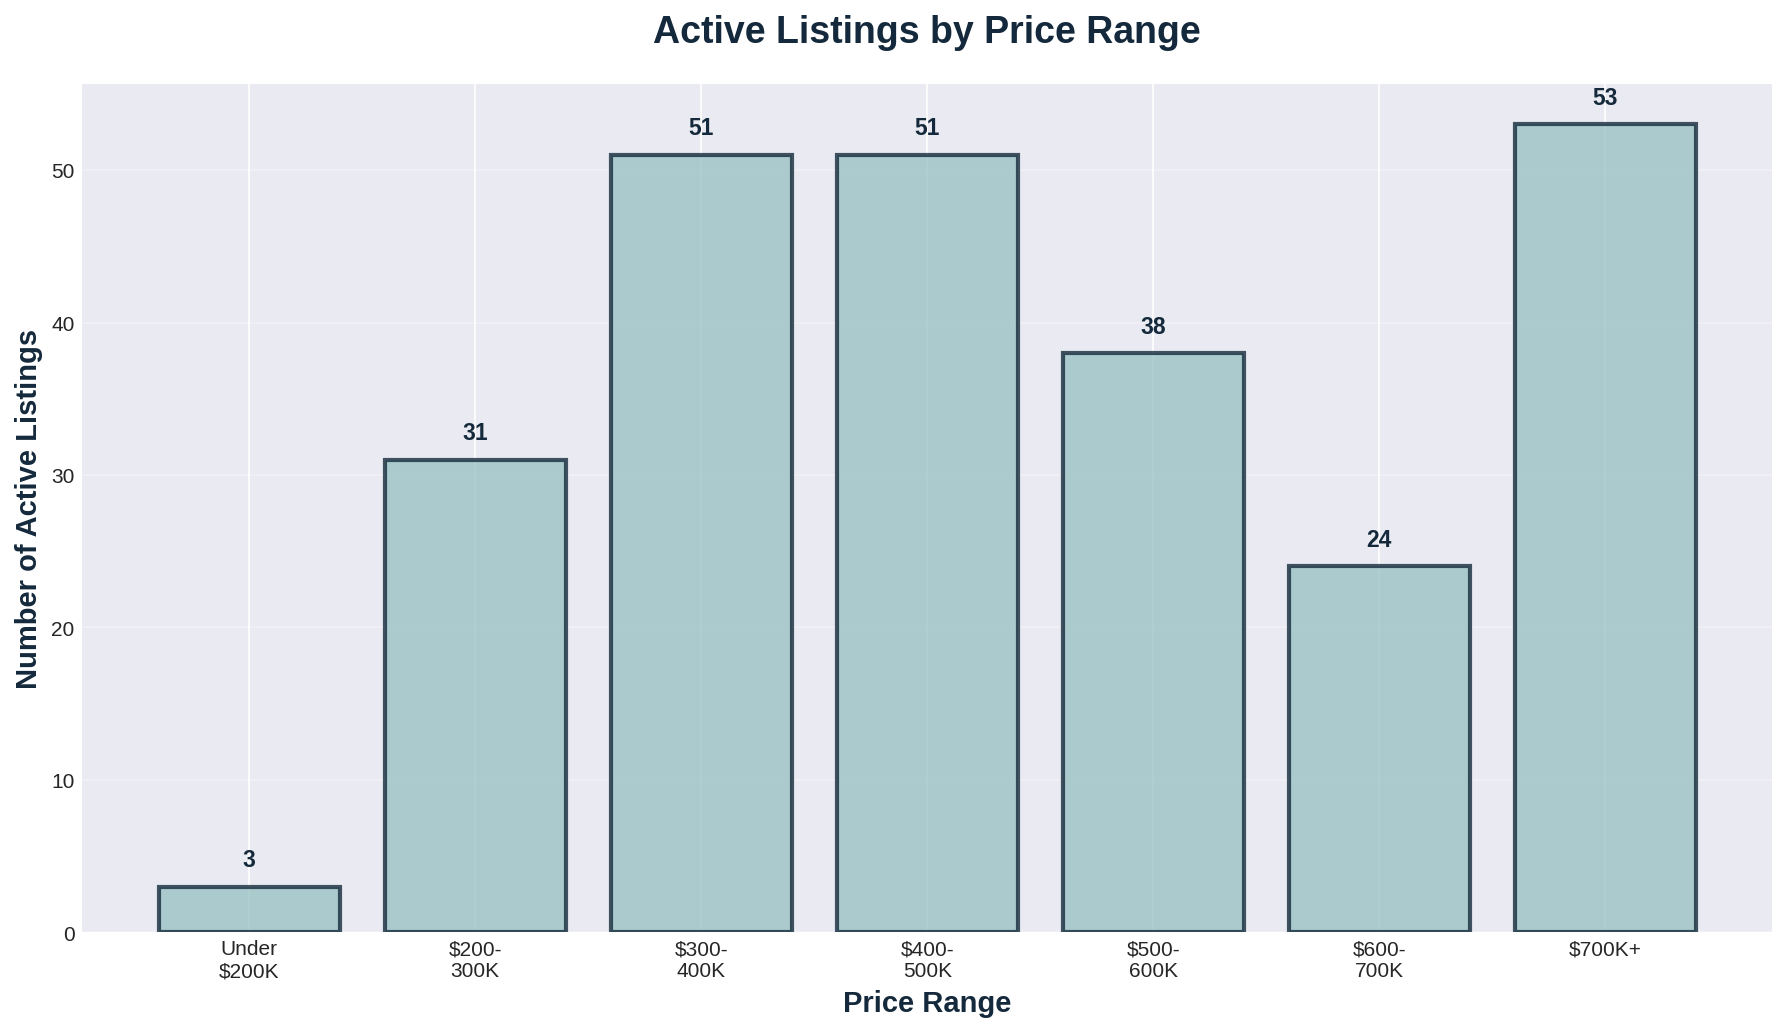
The market shows heavy concentration in the $400K-$700K range with 113 active listings competing for buyers. But here's the kicker: only the $300-400K segment has seen recent sales activity. If you're selling above $500K, buckle up for a longer timeline and be ready to negotiate hard.
Surfside vs. Treasure Island: Tale of Two Markets
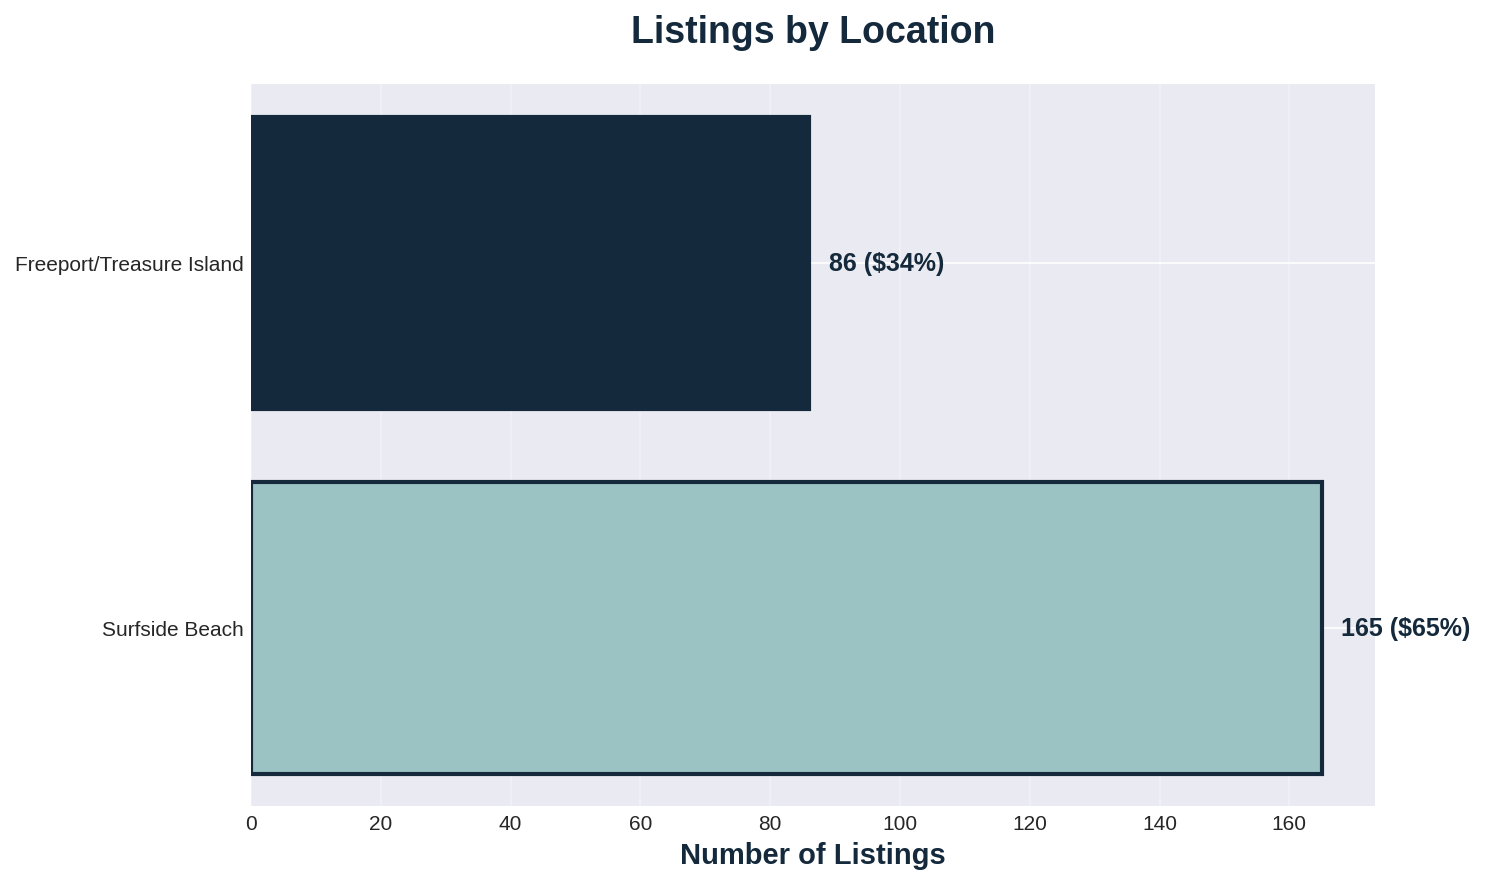
Surfside Beach dominates with 165 listings (66% of market share), while Freeport/Treasure Island holds 86 listings (34%). But market share doesn't tell the whole story—showing activity does.
Surfside Beach: Where Are Buyers Looking?
- 87 Total Showings
- 51 Active Listings
- 1.71 Avg Showings/Listing with no showings over $650K
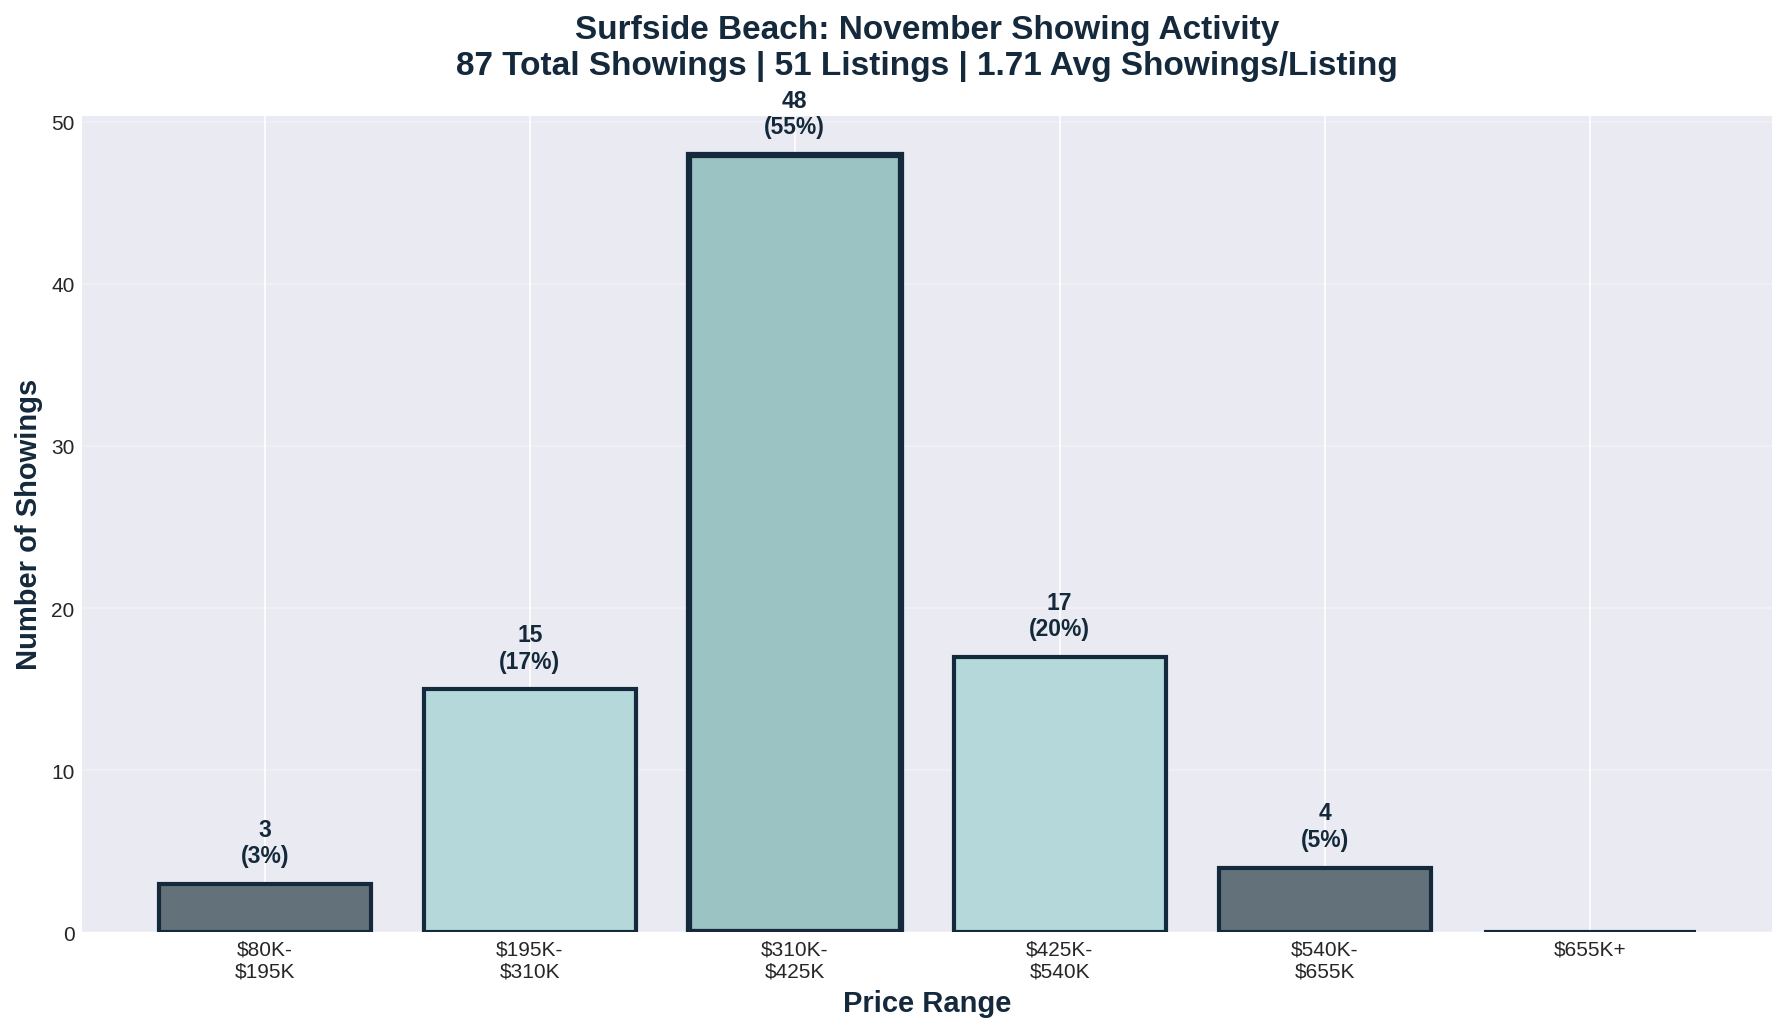
The Surfside Sweet Spot
The data is crystal clear: 55% of all Surfside Beach showings happened in the $310K-$425K range. This is where buyers are actively shopping.
| Price Range | Showings | Listings | % of Total |
|---|---|---|---|
| $80,000 - $194,999 | 3 | 1 | 3% |
| $195,000 - $309,999 | 15 | 10 | 17% |
| $310,000 - $424,999 | 48 | 25 | 55% 🔥 |
| $425,000 - $539,999 | 17 | 12 | 20% |
| $540,000 - $654,999 | 4 | 3 | 5% |
| $655,000+ | 0 | 0 | 0% |
If you're selling above $655K? Zero showings in November. The market has spoken—price matters more than ever in this buyer-driven environment.
Treasure Island: Higher Engagement Per Listing
- 16 Total Showings
- 6 Active Listings
- 2.67 Avg Showings/Listing with no showings above $480K
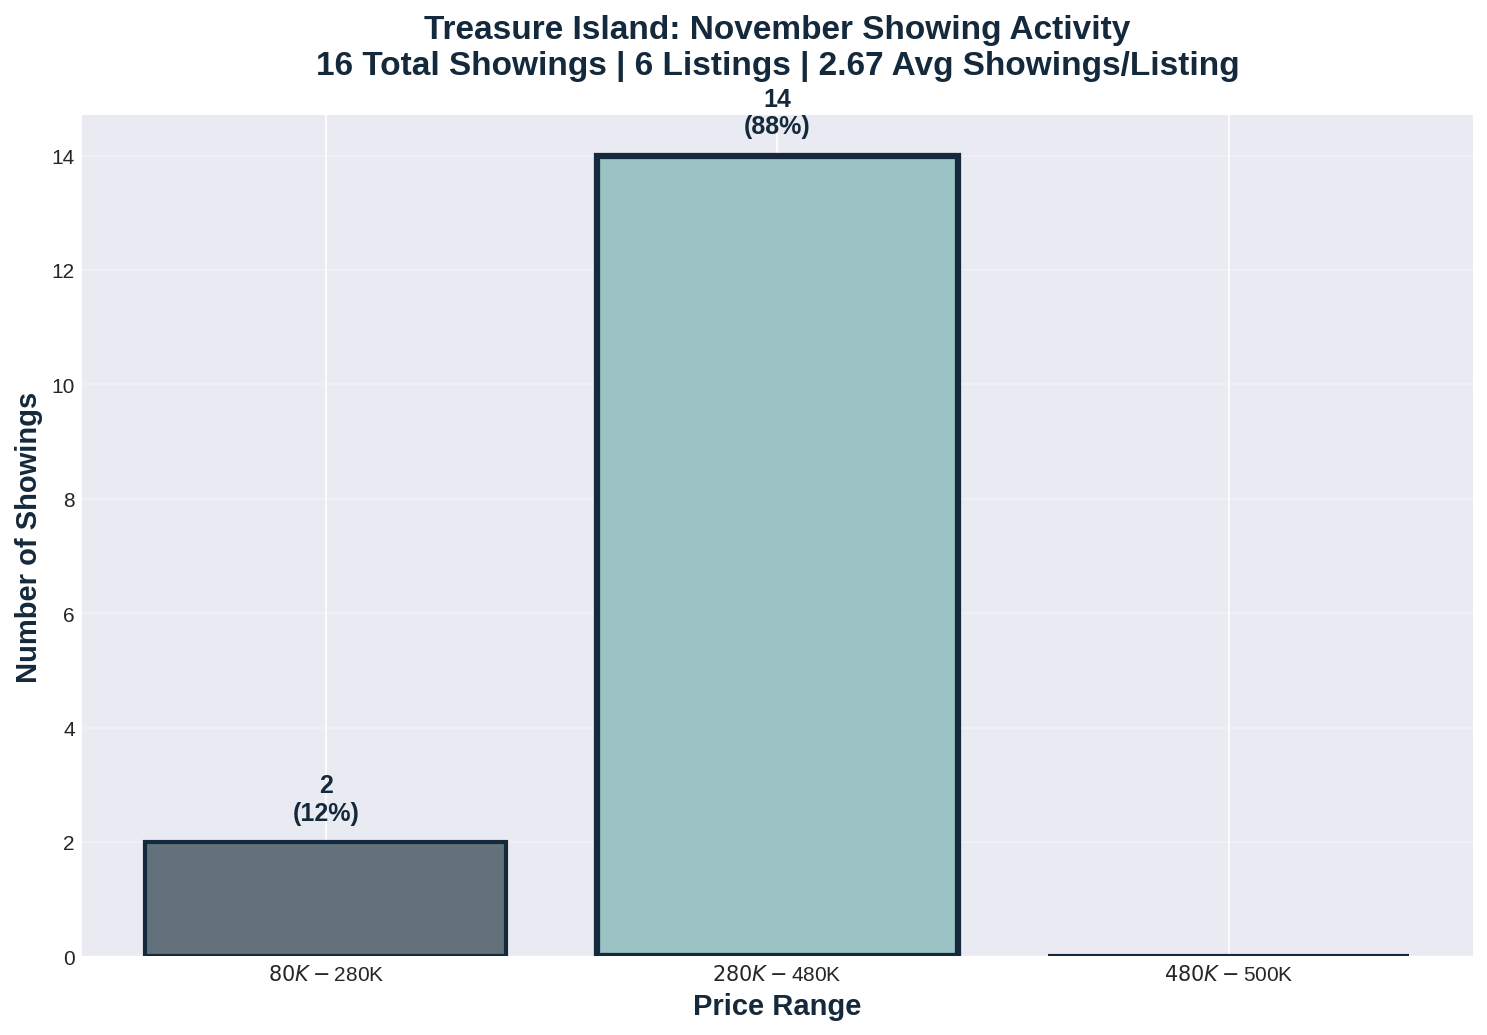
Treasure Island's Active Zone
Treasure Island shows even stronger buyer focus: 88% of showings concentrated in the $280K-$480K range. With 2.67 average showings per listing (vs. 1.71 in Surfside), Treasure Island properties are getting more buyer attention when priced right.
| Price Range | Showings | Listings | % of Total |
|---|---|---|---|
| $80,000 - $279,999 | 2 | 1 | 13% |
| $280,000 - $479,999 | 14 | 5 | 88% 🔥 |
| $480,000 - $500,000 | 0 | 0 | 0% |
The lesson? There's appetite for affordable coastal living, but zero tolerance for what buyer's view as overpricing.
Your Action Plan: What to Do Next
If You're Selling in Surfside Beach or Treasure Island:
- Price aggressively from day one. The days of testing the market with a high price are over. You'll just waste time.
- Know your competition. With 211 active listings, you need to stand out. Professional photos, staging, and strategic marketing aren't optional.
- Be ready to negotiate. First offers might be lower than you'd like, but remember—buyers have options and they know it.
- Consider timing. 339 average days on market means you need patience OR aggressive pricing to move faster.
If You're Buying in Surfside Beach or Treasure Island:
- Don't rush. With this much inventory, you can afford to be selective. BUY Before the Seasonal Rush
- Make strategic offers. Look at days on market for each property—longer DOM means more room to negotiate, if limited price reductions.
- Focus on the $280K-$480K range. This is where you'll find the most showing activity and motivated sellers.
- Get pre-approved. In a buyer's market, being ready to close quickly can give you an edge in negotiations.
Looking Ahead: 2026 Market Outlook
📊 What the Data Predicts
This market isn't turning around overnight. With 35x more listings than sales, we're looking at sustained buyer-favorable conditions through at least Q1 2026. Sellers who adapt to market realities will succeed. Those who don't will watch properties sit.
For buyers, opportunities abound. This is the market you've been waiting for—just make sure you're working with someone who knows how to negotiate in your favor and is familiar with coastal properties. Coastal locations require specific knowledge and experience.
Ready to Make Your Move?
Cathy Carter | Carter Signature Properties
#1 Island Brokerage in Island Sales and Agents
Serving Surfside Beach, Treasure Island, Galveston, and Greater Houston to Dallas/ Fort Worth
Whether you're buying or selling coastal property, you need someone who understands this market inside and out. Let's talk strategy—no fluff, just honest market analysis and a plan that works.
Let's Talk StrategyData sourced from MLS | November 2025 Analysis
©2025 Carter Signature Properties. All rights reserved.