Surfside Beach to Treasure Island Market Report — April 1–16, 2026
What's happening in the Surfside Beach to Treasure Island real estate market right now?
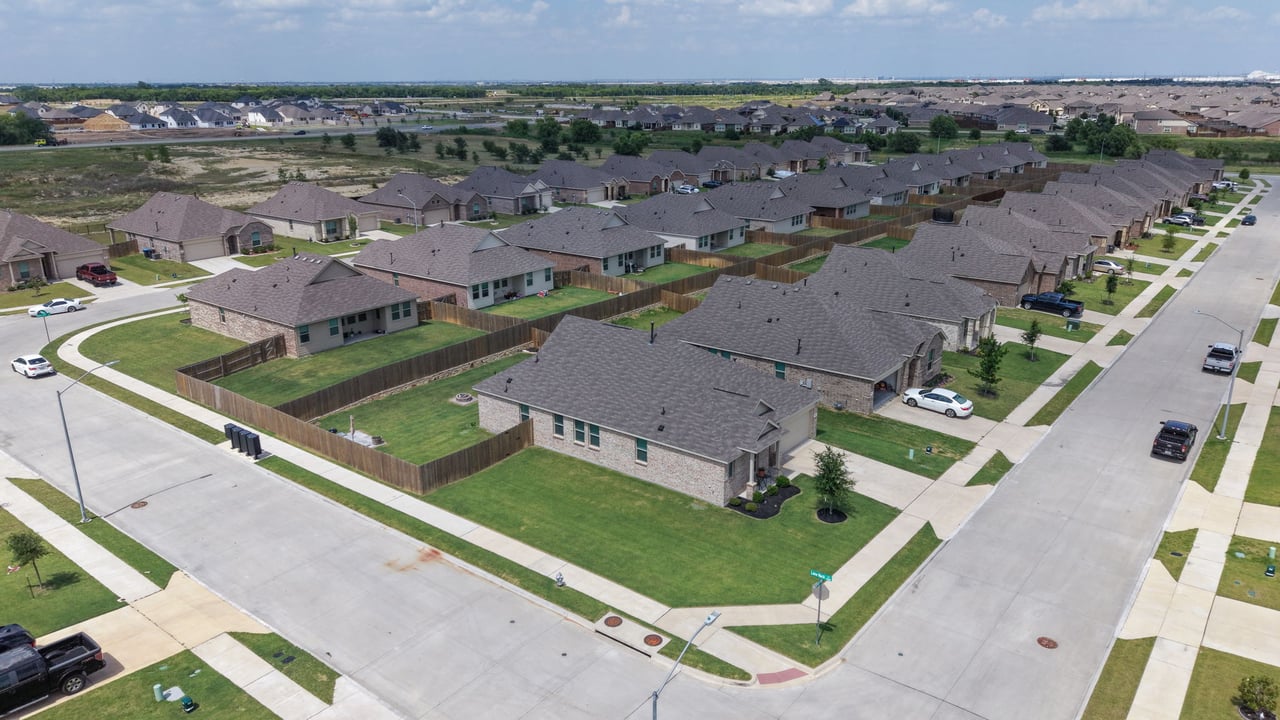
As of mid-April 2026, the Gulf Coast corridor from Surfside Beach to Treasure Island has 230 active listings, 20.4 months of supply, and a median list price of $459,000. Sales prices are resetting significantly lower than years past — this is a heavy buyer's market.
Here's the deal: if you're watching the Surfside Beach, Treasure Island, San Luis Beach, or Freeport market right now, the numbers tell a clear story. Inventory is stacked, buyers have leverage, and sellers who don't price competitively are sitting. Let's break it down.
This report covers April 1–16, 2026 — a half-month snapshot of what's happening across the Gulf Coast corridor in Brazoria County. All data comes directly from HAR MLS and ShowingSmart showing reports.
The Numbers at a Glance
A balanced market sits around 4–6 months of supply. At 20.4 months, this is firmly a buyer's market — and it's been that way for a while. According to the Texas A&M Real Estate Center, Brazoria County inventory has been climbing steadily since late 2024.
The median sold price of $331,500 compared to the median list price of $459,000 tells you something important: the properties that ARE selling are priced significantly lower than the broader market. Sellers who are realistic about pricing are getting deals done. The rest are adding to that 230-listing inventory pile.
Area Breakdown: Where the Inventory Is
Not all areas are created equal. Here's how inventory and pricing stack up across the key communities in the corridor:
| Area | Active | Pending | Sold | Median Price |
|---|---|---|---|---|
| Surfside Beach | 154 | 7 | 2 | $429,450 |
| Treasure Island | 37 | 3 | 2 | $499,950 |
| San Luis Beach | 18 | 0 | 0 | $582,000 |
| Key Largo | 6 | 0 | 0 | $841,500 |
| Tortuga Sands | 4 | 0 | 0 | $1,649,000 |
| Bridge Harbor | 3 | 0 | 0 | $445,000 |
Surfside Beach dominates with 154 active listings — that's two-thirds of the entire corridor's inventory. The city-wide median list price is $429,450. Treasure Island comes in at $499,950, and the newer communities like Tortuga Sands and Key Largo are pushing into the $800K+ territory.
The growth beyond Surfside Beach and Treasure Island is worth noting. San Luis Beach, Key Largo, Tortuga Sands, Seahorse Estates — these communities are expanding the market map. Carter Signature Properties, the largest brokerage on the island, tracks all of them.
Price Distribution: Where the Listings Sit
Here's where the 230 active listings fall by price range:
The $350K–$500K range is the fattest part of the market — 83 listings, or 36% of total inventory. If you're a buyer shopping in that range, you've got options. If you're a seller in that range, you've got a lot of competition.
What Actually Sold: April 1–16
Six properties closed in the first half of April. Here's what moved:
| Address | Area | Sold Price | $/SF | SP/LP | DOM |
|---|---|---|---|---|---|
| 13106 Coronado Dr | Treasure Island | $190,000 | $261 | 95.0% | 883 |
| 526 Blue Water Hwy | BCIC / Bluewater | $305,000 | $276 | 101.7% | 175 |
| 119 Nesmith Pl | Surfside Beach | $325,000 | $254 | 92.9% | 43 |
| 343 Jettyview Rd | Surfside Beach | $338,000 | $223 | 87.8% | 359 |
| 211 Anchor Dr | Treasure Island | $354,000 | $434 | 101.7% | 170 |
| 107 Yucca Ave | Surfside Beach | $805,000 | $334 | 92.5% | 1,092 |
The story of 119 Nesmith Place tells you everything about this market. It was originally listed at $550,000 back in May 2025 — overpriced from the start. That overpricing cost the seller almost a full year on market, multiple price reductions, and ultimately a sale at $325,000 in April 2026 — a 41% drop from where they started. Overpricing from the onset doesn't just delay the sale. It kills buyer interest early, burns through your best showing window, and trains the market to ignore your listing. That's not a one-off story. That's the market resetting. On the other end, 107 Yucca Avenue sat for nearly 3 years before closing at $805,000 (92.5% of its most recent asking price). The average sale-to-list ratio across all 6 closings was 95.3%, meaning buyers are negotiating roughly 5% off current list price — and in many cases, these list prices have already been reduced multiple times.
Showing Activity: Who's Actually Looking?
Surfside Beach
Treasure Island
Combined: 99 showings across 71 listings — just 31% of all active listings received any showing activity at all.
Here's the showing breakdown by price range in Surfside Beach — this is where the buyers are actually looking:
79% of all showing activity is on homes priced under $550K. The $350K–$550K range had the highest per-listing average at 1.55 — but that's 31 showings across 20 listings that were actually shown, not all active listings in that range. Many listings received zero showings during this period.
Showing data from ShowingSmart. Averages are calculated as total showings divided by listings that received at least one showing — not every active listing on the market.
What This Means for You
If You're a Seller
Prices are resetting — and 119 Nesmith Place is your cautionary tale. Listed at $550K in May 2025, overpriced from day one. Nearly a year later it sold for $325K — a 41% loss from original list. Overpricing at the onset doesn't buy you negotiating room. It costs you time, showing traffic, and ultimately money. The numbers your neighbor got in 2023 or 2024? That's not today's market. With 20+ months of supply, buyers have the upper hand and they know it. Price it right from the start — the homes that sell are the ones that respect where the market actually is, not where sellers wish it was.
If You're a Buyer
This is your market. You've got 230 options, leverage to negotiate, and sellers who've been sitting for months (or years). The data says you can expect to land around 5% below current asking — and many of these asking prices have already been cut. Take your time, do your homework, and bring your best offer when you find the right one.
If You're an Investor
The entry-level price points are where the showing action is. Under $350K gets 44% of all showing traffic in Surfside Beach. That's your demand signal. The Brazoria County Appraisal District is a good starting point for running your tax numbers.
If You're a Homeowner: Protest Your Property Taxes
With sale prices coming in well below appraised values, now is the time to challenge your property tax assessment. These recent comps can work in your favor. Carter Signature Properties is offering free property tax protest comps for residents from Surfside Beach to Treasure Island. Click here to request your comps — it takes 30 seconds and could save you hundreds (or thousands) on your next tax bill.
Frequently Asked Questions
Is Surfside Beach TX a buyer's or seller's market in 2026?
As of April 2026, Surfside Beach is a strong buyer's market. With 154 active listings and 20.4 months of supply across the corridor, buyers have significant negotiating power. The average sale-to-list ratio is 95.3%.
How much do homes cost in the Surfside Beach to Treasure Island corridor?
The median list price across the corridor is $459,000. Surfside Beach city-wide median is $429,450, Treasure Island is $499,950, and newer communities like Key Largo and Tortuga Sands range from $841K to $1.6M.
How many showings are homes getting in Surfside Beach?
In the first half of April 2026, Surfside Beach had 88 showings across 62 listings — but only 40% of active listings received any showing activity. Homes priced under $550K get the most traffic, with 79% of all showings in that range.
Can I use recent sales to protest my property taxes in Surfside Beach or Treasure Island?
Yes. With sale prices resetting well below prior-year appraised values, many homeowners from Surfside Beach to Treasure Island have strong grounds for a property tax protest. Carter Signature Properties offers free comps for tax protests — request yours here.
Curious what your coastal property is worth?
Whether you're thinking of selling, buying, or just want to know where you stand — let's talk.
Cathy Carter, Broker / Founder — Carter Signature Properties
The Largest Brokerage on the Island
Experience the Signature Difference
Data sourced from HAR MLS and ShowingSmart. Information deemed reliable but not guaranteed. This report is not an appraisal. © 2026 Carter Signature Properties. All rights reserved.