Surfside Beach to Treasure Island Market Report: September 2026
What are homes selling for in Surfside Beach and Treasure Island, TX right now?
Homes from Surfside Beach to Treasure Island closed at a median of $357,500 in September 2026 across thirteen sales, with 192 active listings and roughly 15 months of supply — down from about 31 months in August.
September was the best month this coast has had in a long time. Thirteen homes closed, nearly double August's seven. Inventory dropped by twenty-six listings. Months of supply was cut in half.
And every bit of it was paid for by sellers.
That is the honest read, and the rest of this report is the evidence. You can explore the full interactive September report here — homes, land, showing activity and area charts — or browse every active listing from Surfside Beach to Treasure Island and see the competition for yourself.
September 2026 by the numbers
Homes, townhomes and condominiums combined, across Surfside Beach, Treasure Island, San Luis Beach, Bridge Harbor and Key Largo Resort:
Metric | August | September |
|---|---|---|
Homes sold | 7 | 13 |
Active listings | 218 | 192 |
Months of supply | ~31 | ~15 |
Median sale price | $345,000 | $357,500 |
Sale-to-list price | 95.6% | 88.7% |
Median days on market | 71 | 152 |
Read the top three rows and this looks like a recovery. Read the bottom two and you see the mechanism. Sellers accepted 88.7% of their asking price, almost seven points worse than August, and waited 152 days instead of 71 to get there. Two homes closed under 70% of list.
The market did not find new demand in September. It found sellers who were finally willing to meet the price.
The gap is still there in the active listings. Median asking price sits at $425,000 while the median home actually sold for $357,500 — a $67,500 spread between what sellers believe and what buyers are signing.
15 months of supply is progress, not balance
A balanced market runs four to six months of supply. The Surfside Beach 77541 corridor spent August near 31 months. September came in around 15.
That is the largest single-month improvement this coast has seen in a long while, and it happened because two things moved at once: thirteen homes closed instead of seven, and twenty-six listings came off the board. Both directions help.
It is still two to three times a balanced market. Buyers keep the advantage. The gap just narrowed. For broader context, the National Association of REALTORS® tracks national inventory trends and the Texas Real Estate Research Center at Texas A&M publishes Texas-specific data, though coastal second-home markets like Brazoria County run on their own cycle.
The showing numbers are about October, not September
Here is the part that changes what you should do next.
Showings lead closings by roughly sixty to ninety days. The thirteen homes that closed in September came from July and August buyer traffic. September's own traffic tells you about the fall:
Surfside Beach: 144 showings across 81 listings, averaging 1.78 per listing. August was 212 showings across 101 listings. That is a drop of about a third — and September's report covered a wider price band than August's, so the real decline in buyer traffic is steeper than the raw numbers show.
Treasure Island: 6 showings. Four homes. Identical to August, down to the decimal. Treasure Island carries 29 active homes and 26 active lots, so twenty-five houses went another full month with nobody walking through the door.
Within Surfside, the $250,000 to $449,999 band pulled 79 of the 144 showings — 55% of all September traffic. Between $650,000 and $1,050,000 the entire market produced five showings across four listings.
What a seller should take from that
Pricing high does not create negotiating room. It creates silence. You never get the showing, so you never get the offer you were planning to counter.
A showing you cannot take is a buyer you never get back. Renters in the house, cleaners have not come, you are four hours away in Houston — that buyer does not reschedule. They go see one of the other 192 homes that same afternoon. In a tight market buyers circle back. In this one there is no reason to.
Buyers are not negotiating. They are moving on.
A buyer writes an offer. The seller counters, or says no. In 2021 that buyer sharpened their pencil and came back. In 2026 they shrug and write on the next house, because there are 192 of them and nothing on this coast is scarce.
They keep writing until somebody says yes. The two September sales that closed under 70% of asking were not aggressive buyers — they were sellers who finally stopped waiting.
Thirteen homes closed between $150,000 and $750,000. The common thread in the fast ones was a number buyers recognized on day one.
Land is a different market, and it has stopped
113 lots listed. One sold. A $25,000 lot in Bayview that took 983 days to find a buyer. At that pace it would take well over a hundred months to clear the land inventory, against about 15 months for houses.
Active lots carry a median asking price of $179,900 and a median 405 days on market. Seventy-three of the 113 have been listed more than a year. Treasure Island alone holds 26 of them.
The reason is straightforward. Buyers who want the Texas Gulf Coast right now are buying houses they can use this season, not lots they would have to build on — especially with construction costs where they are and finished inventory this deep. If you are holding a lot and waiting for the house market's momentum to carry it, September says it is not carrying.
Anyone selling a lot should price against the lots that actually sold, not against what the lot next door is asking. Property records for comparison are available through the Brazoria Central Appraisal District.
One caveat on price per square foot
On the coast, square footage is a yardstick, not a verdict.
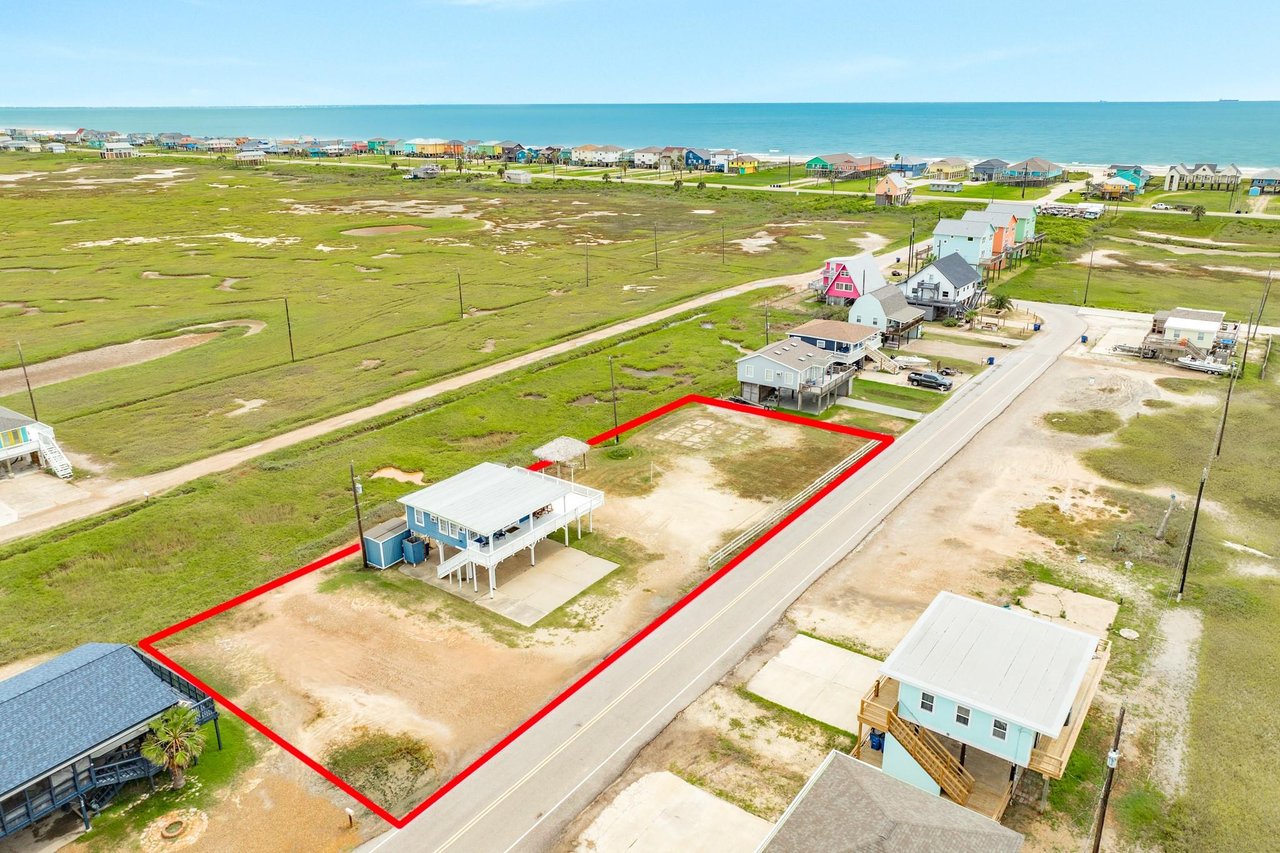
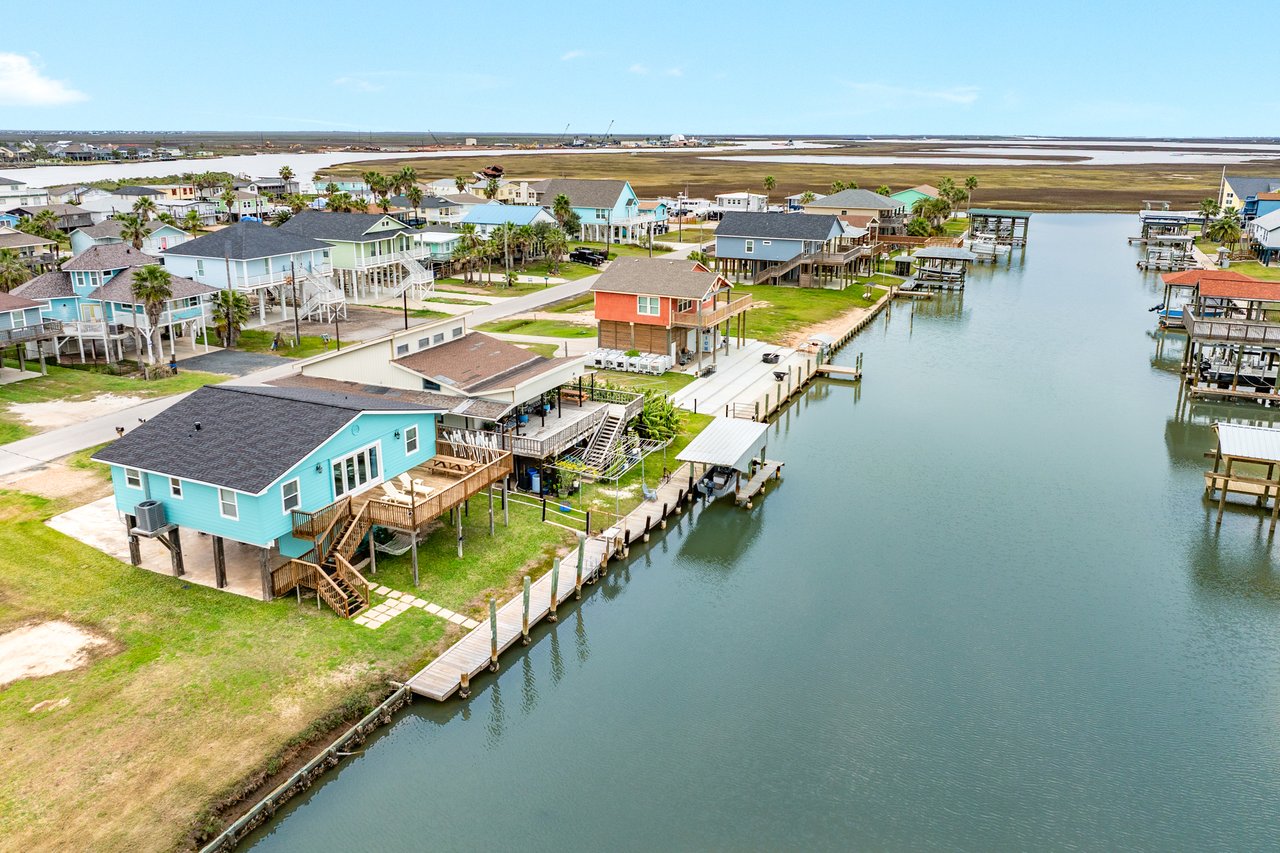
Beach property is priced first on location and views — beachfront, beach view, second row, canal, or several streets back. Two homes of identical size can be hundreds of thousands of dollars apart on position alone. Elevation, deck orientation and what you actually see from the porch matter more here than they do anywhere inland.
Use these numbers to understand the direction of the market. Then price a specific home on its specific spot. That is where Carter Signature Properties — the largest brokerage on the island — earns its keep.
What to do with this
If you are selling a house: September proved the market will transact. It also proved what it costs. List at the number, make the home easy to show, and move while there is still momentum — the showing data says the buyer pool behind you is thinner.
If you are selling a lot: price it against closed sales, not neighboring list prices, and expect a long runway. Seventy-three of the 113 active lots have already been waiting more than a year — the land section of the full report breaks them out by price band and by area.
If you are buying: you have leverage. Sellers closed 11.3 percentage points under list in September. Inventory is deep across every band. The homes worth your attention are the ones priced honestly on day one. Start with the current listings from Surfside Beach to Treasure Island.
Frequently asked questions
What are homes selling for in Surfside Beach, TX in 2026?
Homes from Surfside Beach to Treasure Island closed at a median of $357,500 in September 2026, across thirteen sales. The median asking price on active listings is $425,000, so there is roughly a $67,500 gap between what sellers are asking and what buyers are paying.
Is the Surfside Beach housing market improving?
By volume, yes. September 2026 produced thirteen home sales against seven in August, and active inventory fell from 218 to 192, cutting months of supply from about 31 to roughly 15. But sellers closed at 88.7% of list price, down from 95.6% in August, so the improvement came from price concessions rather than new demand.
How long does it take to sell a lot in Surfside Beach or Treasure Island?
Land is moving far slower than houses. In September 2026, 113 lots were listed across the corridor and one sold, for $25,000 after 983 days on market. Active lots carry a median of 405 days on market and 73 of the 113 have been listed more than a year.
Why are Treasure Island homes not selling?
Treasure Island recorded 6 showings across 4 homes in September 2026, identical to August, against 29 active homes and 26 active lots. Only one home closed there all month. Homes priced above what buyers recognize are not generating showings at all, so they never reach the offer stage.
Get a straight read on your property
September moved more houses than any month in a while, and the sellers who sold did it by meeting the market where it is. The showing data says the fall buyer pool is thinner than the one that produced those results.
If you own a home or a lot on Surfside Beach, Treasure Island, San Luis Beach, Bridge Harbor or in Key Largo Resort and want to know what it will actually sell for — with the comps, the showing numbers and the beach-proximity factors that apply to your specific street — let's talk.
Want the detail behind these numbers? View the full interactive September 2026 market report — every closed sale, area-by-area charts, the showing breakdown by price band, and the complete land picture.
Contact Cathy Carter, Broker/Founder at Carter Signature Properties, the largest brokerage on the island, at 972-358-6420 or [email protected].
Experience the Signature Difference.
Data sourced from the local MLS and MLS showing activity reports for 09/01/2026–09/30/2026, covering Surfside Beach, Treasure Island, San Luis Beach, Bridge Harbor and Key Largo Resort. Home figures include single family, townhomes and condominiums. Surfside showing figures reflect listings priced $50,000–$1,500,000; the August comparison used a $100,000–$1,000,000 band, so month-over-month band detail is not directly comparable. Months of supply is calculated from a single month of closings and will move as sales volume changes. Information deemed reliable but not guaranteed. This report is not an appraisal. Equal Housing Opportunity.