The Island Numbers Are In—And Buyers, You're in Control
I just wrapped up the numbers for the first 15 days of November across Surfside Beach, Bridge Harbor, and Treasure Island, and if you've been waiting for the "right time" to make a move on the island—this is it.
Let me cut straight to it: This is purely a buyer's market.
- • 219 active listings (you have options)
- • 343 average days on market (sellers are waiting)
- • 13 properties pending (deals are happening, but slowly)
- • 2 homes closed in November — both in Surfside, both under $275K
When homes sit on the market for nearly a year, that's not a "wait and see" situation. That's negotiating leverage handed to you on a silver platter.
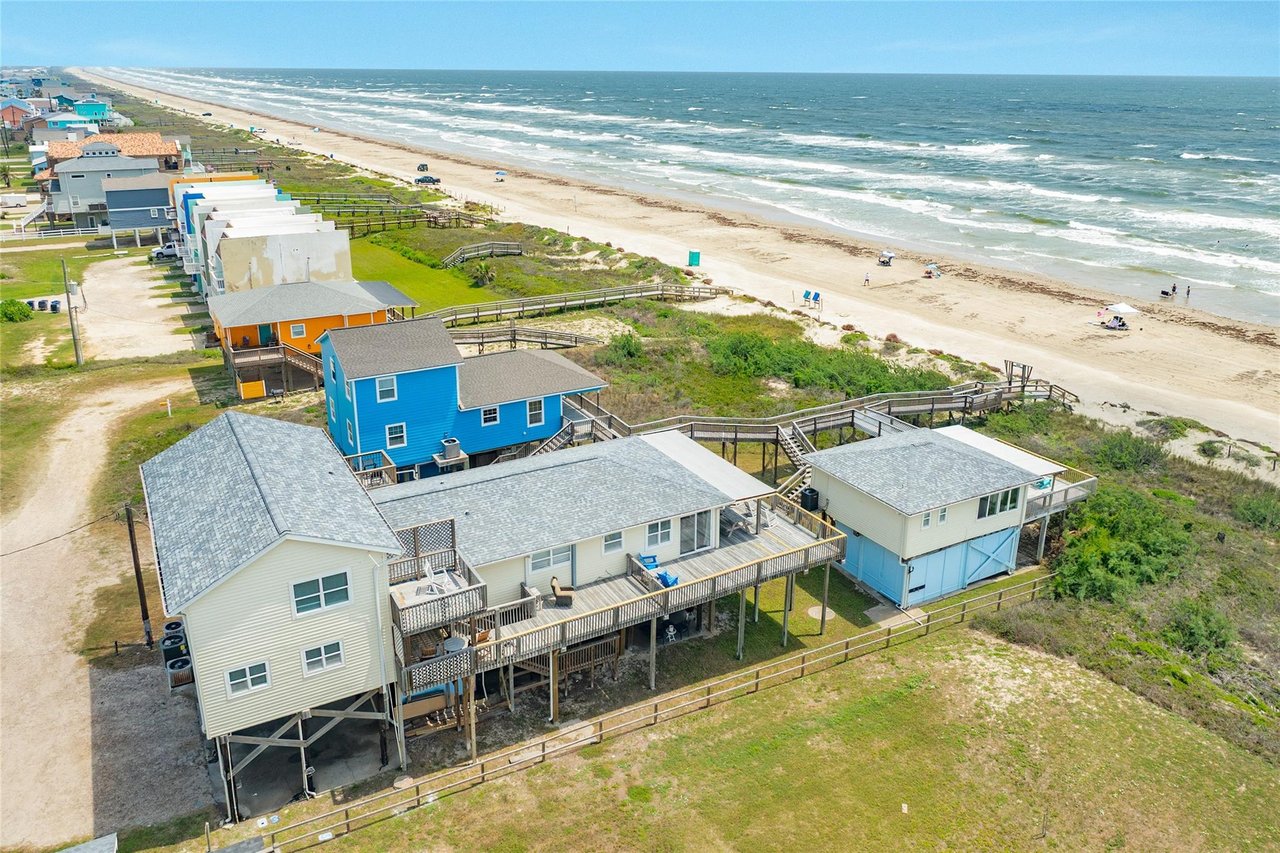
🏝️ Entire Island Market Overview
Surfside Beach, Bridge Harbor to Treasure Island | ZIP 77541
Recent Closings (November 2025)
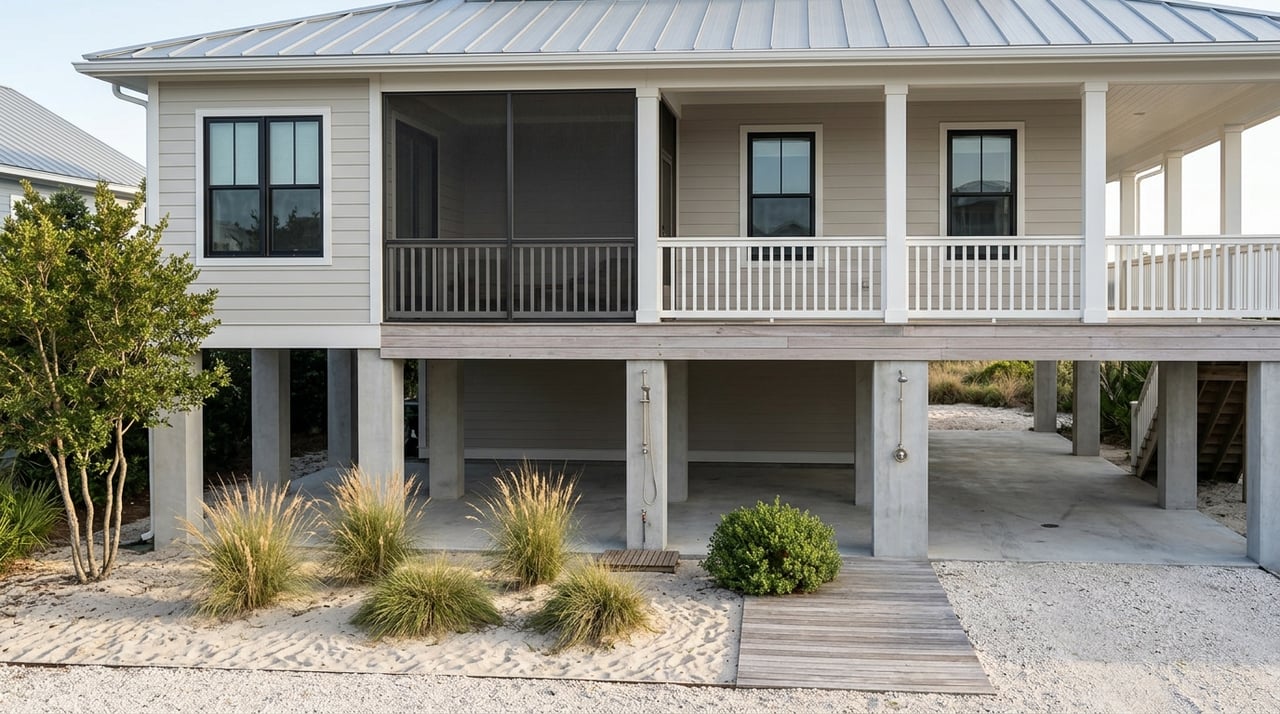
🏖️ Surfside Beach Market
Primary coastal residential market
Latest Pending Contract
Showing Activity (Nov 1-15, 2025)
Most active price range: $300K-$499K captured 60% of showing activity (26 showings across 19 listings)
🏝️ Treasure Island Market
Premium island subdivision
Showing Activity (Nov 1-15, 2025)
📊 Island-Wide Market Trends
This is purely a buyer's market. With 219 active listings and an average CDOM of 343 days, buyers have substantial leverage and inventory to choose from. Recent closings at $247K and $274K demonstrate transaction activity in the entry-level segment. Thirteen pending contracts averaging $541K show that motivated sellers are negotiating across price points. The spread from $120K to $3.2M offers opportunities for every buyer profile—and the extended days on market means you can negotiate.
🏖️ Surfside Beach Performance
Surfside dominates with 143 active listings and a lower average CDOM (328 days vs island average of 343). Here's the critical number: the average closing sales price was under $300K ($260,500 to be exact). This confirms what we've seen trending most of the year—homes in the $250K-$350K range are moving.
The $300K-$499K range captured 60% of showing activity with 26 showings across 19 listings, proving this is where buyer interest peaks. Eleven pending contracts averaging $411K show buyers are willing to go higher for the right property, but deals are closing below $300K. Both November closings occurred here, proving transaction velocity.
🏝️ Treasure Island Dynamics
Treasure Island shows premium market characteristics with only 32 active listings but commanding a higher average list price ($560K vs Surfside's $489K).
However, the 454-day average CDOM suggests sellers must be strategic with pricing. The single pending contract at $469K and zero November closings signal a market that rewards patience and precision. Showings are trending slightly upward, suggesting renewed buyer interest and momentum building.
💡 Strategic Takeaways
For Sellers: Surfside's average sales price has been trending in the $250K-$350K range most of the year—price accordingly if you want to close. Properties above this range are getting showings but not selling. Treasure Island sellers face longer market times but showings are trending slightly upwards, suggesting renewed buyer interest. Price strategically and prepare for longer timelines, but momentum is building.
For Buyers: This is your market. Surfside offers volume and variety with strong negotiation leverage across 143 listings. Homes are closing under $300K despite higher list prices. Treasure Island provides exclusivity with less competition between properties but more competition for each property, and showing activity is picking up. Sub-$300K deals exist (2 recent closings prove it), and 13 pending deals show motivated sellers island-wide. Strike now while CDOM is high and inventory is broad.
Let's Make Your Island Move
Whether you're drawn to Surfside's variety or Treasure Island's exclusivity, Carter Signature Properties brings the local expertise and market intelligence to help you win. Two closings this month, 13 properties under contract, and 219 opportunities waiting—let's find yours.
Carter Signature Properties | Serving Haslet, Alliance Area, North Fort Worth, Lake Jackson, Surfside Beach, Galveston, Greater Houston, Austin, and DFW
#1 Real Estate Brokerage | Experience the Signature Difference
Data compiled from MLS and ShowingSmart for Nov 1-15, 2025. Market statistics are subject to change. This report is for informational purposes only. All information believed accurate but not guaranteed. Equal Housing Opportunity. © 2025 Carter Signature Properties.