What's Happening in the Surfside Beach & Treasure Island Housing Market Right Now?
By Cathy Carter, Broker/Founder, Carter Signature Properties — Published August 1, 2026
Eight homes closed across the Surfside Beach to Treasure Island corridor in July 2026. Meanwhile, there are 232 active listings sitting on the market right now. Do the math and you land on close to 29 months of supply — nowhere near the 4 to 6 months that usually signals a balanced market.
That's not a scare headline. It's just what the numbers say, and it matters whether you're buying your first place on the water or deciding whether this is the year to sell. Here's the full breakdown, pulled straight from July's MLS activity for Surfside Beach, Treasure Island, and the surrounding Brazoria County communities.
232 Active Listings | 8 Homes Sold | $325,950 Median Sale Price | 29 mo Months of Supply |
The Big Picture: A Buyer's Market on the Texas Gulf Coast
For context, Texas as a whole is sitting at about 5 months of supply and 82 average days on market, according to the Texas Real Estate Research Center at Texas A&M University. Nationally, existing-home inventory is running about 4.6 months, per the National Association of Realtors. The Surfside-to-Treasure-Island corridor is running at roughly six times that pace.
Surfside–Treasure Island Corridor | 29 mo | |
Texas Statewide | 5 mo | |
National | 4.6 mo |
Add in mortgage rates that just touched a 6.66% average — a 12-month high, according to Freddie Mac's Primary Mortgage Market Survey — and it's easy to see why coastal buyers are taking their time. That's good news if you're shopping. It's a call to be strategic if you're selling.
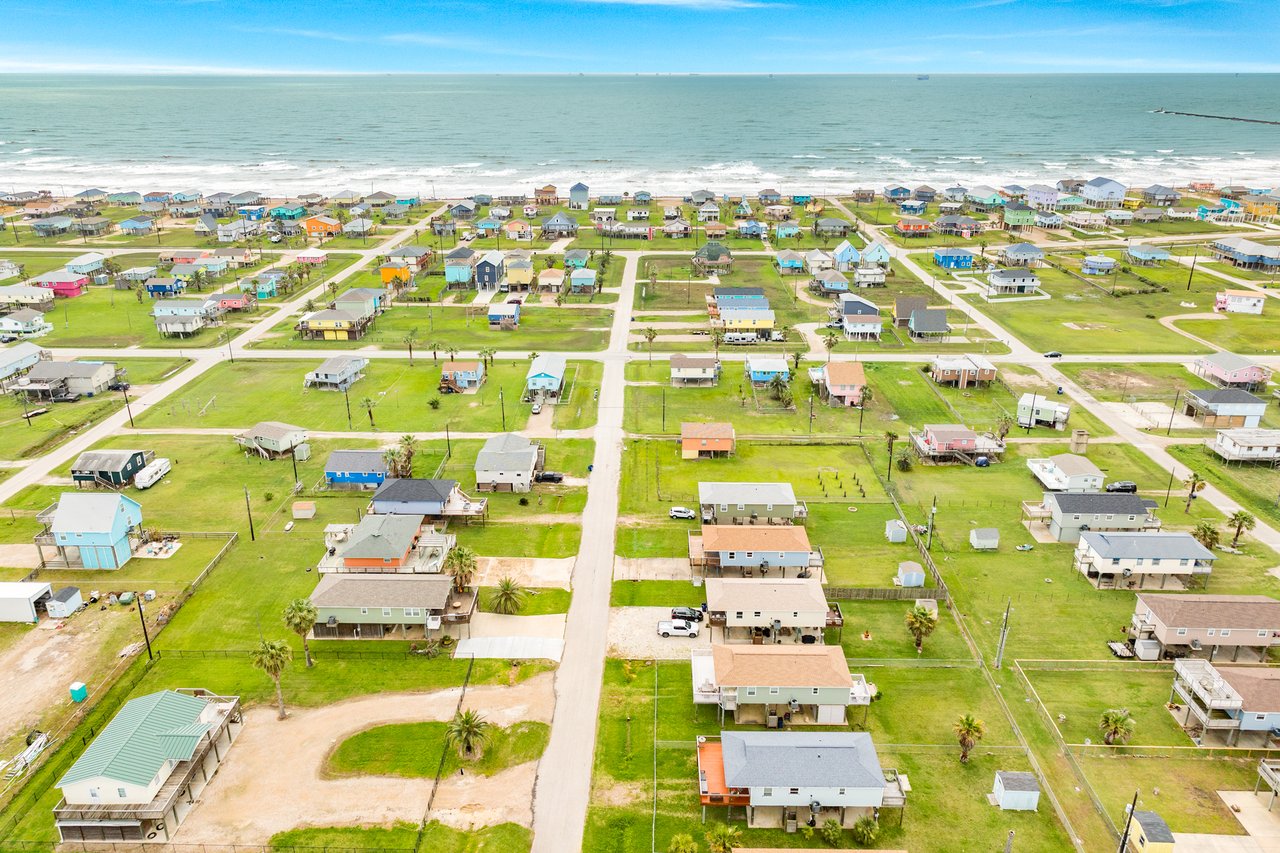
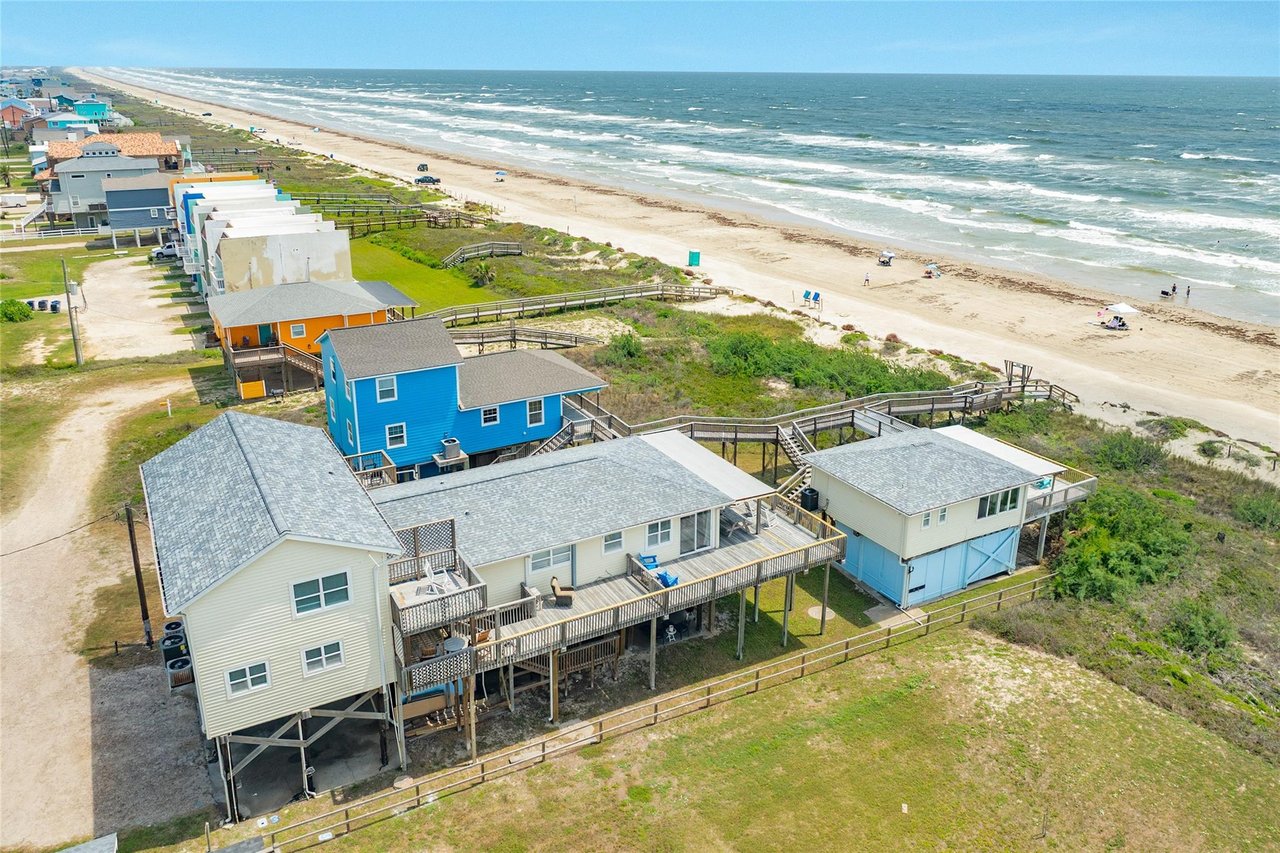
Surfside: Where Most of the Action Is
Surfside Beach carried the most activity in the corridor this July: 151 active listings, 5 closed sales, and 6 more homes under contract. The median closed price landed at $359,900, with sold homes averaging $267.95 per square foot and a 94.3% sale-to-list ratio — meaning sellers who priced accurately still gave up some ground at the negotiating table, but not much.
Carter Signature Properties was the listing agent on 3 of those 5 closed Surfside sales this month — more than half of everything that sold in the area. If you're weighing who knows this specific stretch of coastline well enough to price it right, that track record is worth asking about.
Homes that did sell in Surfside took an average of 331 days to close. That's a long runway, and it tells buyers something important: overpriced or poorly marketed listings sit, and sit, and sit.
Surfside Showing Activity by Price Band (July 2026)
$150K–$349,999 | 82 | |
$350K–$549,999 | 44 | |
$550K–$749,999 | 8 | |
$750K–$949,999 | 9 | |
$950K–$1,149,999 | 0 | |
$1.15M–$1.2M | 1 |
Price Range | Showings | Listings Shown |
|---|---|---|
$150,000–$349,999 | 82 | 40 |
$350,000–$549,999 | 44 | 31 |
$550,000–$749,999 | 8 | 6 |
$750,000–$949,999 | 9 | 6 |
$950,000–$1,149,999 | 0 | 0 |
$1,150,000–$1,200,000 | 1 | 1 |
Buyer traffic is heaviest under $350,000 — 82 showings across just 40 listings in that range. That's where the competition for well-priced homes is real, even in a slow overall market.
Treasure Island: Quiet Activity, Zero Closings
Treasure Island tells a different story, and it's an important one to get right. There were 33 active listings and 3 pending sales in July, but zero closings recorded for the month. Showing activity was thin: only 8 of those 33 active listings — about 1 in 4 — recorded any showings at all. Those 8 listings saw 16 showings total, an average of 2 showings apiece. That's not a wave of buyer interest across the board; it's a small slice of the inventory getting looked at, and even that didn't convert to an offer.
Treasure Island Showing Coverage — July 2026
8 of 33 active listings (24%) recorded a showing in July — the other 25 listings had none.
Active Treasure Island listings are averaging 442 days on market with a median list price of $499,900. Low engagement plus zero closings usually points to a pricing gap, not a lack of long-term demand for the area. Sellers who want to generate real traffic — the kind that leads to an offer — should take a hard look at where their price sits relative to what's actually moving elsewhere in the corridor.
The Rest of the Corridor: San Luis Beach, Key Largo, Bridge Harbor & More
Beyond Surfside proper and Treasure Island, the wider corridor — communities like San Luis Beach, Key Largo, and Bridge Harbor — logged 48 active listings, 3 closed sales, and 2 pending. The median closed price here was $250,000, noticeably lower than Surfside's $359,900, while the median active list price runs higher at $579,000. That gap between what's listed and what's actually closing is worth watching if you own property in these communities.
Active Listings by Area (July 2026)
Surfside | 151 | |
Other Corridor | 48 | |
Treasure Island | 33 |
Every July 2026 Closing in the Corridor
Here's every home that closed across Surfside Beach, Treasure Island, and the wider corridor in July 2026 — straight from the MLS extract, no exceptions and nothing left out.
Area | Subdivision | Close Date | Price | DOM | $/SF | SP/LP | Beds/Baths | SqFt | Built |
|---|---|---|---|---|---|---|---|---|---|
Surfside | Surfside | 7/2/26 | $157,000 | 210 | $118.94 | 84.9% | 3/2 | 1,320 | 1970 |
Other Corridor | Surfside Townsite (Freeport) | 7/13/26 | $220,000 | 115 | $208.33 | 88.4% | 2/2 | 1,056 | 1965 |
Other Corridor | Bridge Harbor | 7/28/26 | $250,000 | 16 | $213.86 | 83.5% | 3/2 | 1,169 | 1975 |
Surfside | The Lagoon | 7/31/26 | $292,000 | 285 | $276.52 | 95.8% | 3/2 | 1,056 | 2014 |
Surfside | Surfside Townsite Sec 3 | 7/31/26 | $359,900 | 730 | $236.78 | 100% | 3/2 | 1,520 | 1965 |
Surfside | Ja-Dot Sub | 7/28/26 | $407,200 | 127 | $320.63 | 97.4% | 3/3 | 1,270 | 2014 |
Surfside | Surfside Townsite | 7/3/26 | $418,000 | 304 | $267.95 | 93.3% | 3/3 | 1,560 | 2025 |
Other Corridor | Key Largo (Freeport) | 7/13/26 | $425,000 | 98 | $279.79 | 94.4% | 4/2 | 1,519 | 2001 |
Notice the DOM column: closings ranged from 16 days (Bridge Harbor) to 730 days — two full years — for a Surfside Townsite Sec 3 home. That spread says everything about why pricing strategy matters more than ever right now.
What This Means If You're Buying
- You have leverage. With this much inventory, there's no reason to waive inspections or skip negotiating on price and repairs.
- Well-priced homes under $350,000 in Surfside are still getting real traffic — don't assume every listing will sit for months.
- Treasure Island is worth watching closely. Only 1 in 4 active listings got a showing at all in July, and zero closed — that combination can mean a price correction is coming.
What This Means If You're Selling
- Accurate pricing matters more than ever. Corridor-wide, sellers who closed averaged a 92.2% sale-to-list ratio — homes priced too high aren't just sitting, they're eventually selling for less than a realistic price would have gotten upfront.
- 331 average days on market in Surfside means your listing needs to be positioned to stand out from day one, not month nine.
- If you're in Treasure Island and your home isn't getting shown at all, that's data, not bad luck. Getting shown — let alone getting an offer — starts with the right price.
Frequently Asked Questions
Is Surfside Beach, TX a good real estate investment right now?
It depends on your timeline. With roughly 30 months of supply in Surfside as of July 2026, sellers have less leverage and homes are taking longer to close (an average of 331 days on market for July's sold homes). For buyers with patience and a long-term hold strategy, that same oversupply can mean more room to negotiate on price and terms.
How long do homes sit on the market in the Surfside Beach and Treasure Island corridor?
In July 2026, homes that closed in Surfside averaged 331 days on market, and active Treasure Island listings averaged 442 days. Both are well above the statewide Texas average of 82 days reported by the Texas Real Estate Research Center, reflecting the slower pace typical of a heavily buyer-favored coastal market.
Why did Treasure Island have no home closings in July 2026?
Only 8 of Treasure Island's 33 active listings recorded any showings in July 2026 — 16 showings total, an average of 2 per home actually shown — and none of those listings closed. That points to a pricing or negotiation gap rather than strong buyer demand across the board.
Ready to find out what your coastal property is worth in this market? Contact Cathy Carter, Broker at Carter Signature Properties — the Gulf Coast's largest island brokerage — at 972-358-6420 or [email protected].
Experience the Signature Difference.