Surfside Beach · Treasure Island · Brazoria County
The 2026 Island Land Market: Why 3 Out of 4 Lot Listings Never Sold
Twelve vacant homesites changed hands on the island between January and August 2026. Thirty-three listings gave up trying. That ratio — not the median price — is the number that should shape every lot pricing conversation from Surfside Beach to Treasure Island.
Most market reports only count what sold. On residential resale that is usually fine. On vacant land, it hides the more useful half of the story — because on the island, the typical lot listing does not end in a closing at all.
Here is what actually happened to island land listings in 2026: 45 homesite listings under one acre came off the market. Twelve sold. Twenty-one expired. Twelve were withdrawn by the seller. That is a 27% sell-through rate, or roughly 2.8 failures for every sale.
If you own a lot on this island and you are wondering why it hasn't sold, you are not the exception. You are the statistical norm. The good news is that the data is very clear about what separates the 27% from everyone else.
What Separated the Lots That Sold From the Ones That Didn't
The difference was not location, and it was not the land. It was the number on the sign.
Outcome | Count | Median Price | Median Days on Market |
|---|---|---|---|
Sold | 12 | $55,000 | 200 |
Expired or terminated | 33 | $115,000 | 365 |
Still active today | 91 | $120,000 | 378 |
Lots that expired or were pulled were asking a median of $115,000 — about 2.1× what the sold lots actually got — and they sat a median of 365 days before quitting. A full year of showings, price reductions and no offers.
The lots that did close took a median of 200 days and settled at 83% of list price. On a house, that ratio usually lands in the high nineties. On land, the asking price is an opening position, and every buyer working this island already knows it.
Price per lot square foot tells the same story
Because island lots range from about 3,500 square feet to over 20,000, comparing sticker prices is misleading. Per lot square foot, the gap is just as wide: sellers are currently asking a median of $20.00 per lot square foot while buyers in 2026 paid $12.12 — roughly 1.7×. Lots then closed 17% under list on top of that.
Surfside Beach vs. Treasure Island: Two Very Different Markets
The island is not one land market. It is at least two, and they are behaving nothing alike.
Area | Sold | Active | Failed | Sell-Through | Months of Supply |
|---|---|---|---|---|---|
Surfside Beach | 7 | 50 | 16 | 30% | 57.1 |
Treasure Island | 1 | 27 | 13 | 7% | 216.0 |
Key Largo | 2 | 4 | 1 | 67% | 16.0 |
Bayview / Lazy Palms | 1 | 2 | 0 | 100% | 16.0 |
San Luis Beach | 0 | 4 | 1 | — | — |
Surfside Beach carried the year: 7 of the 12 closings, 50 active listings, and a 30% sell-through rate. Still a deep buyer's market at 57 months of supply, but functioning.
Treasure Island is the cautionary tale. 27 lots active, 13 listings failed, one sale all year. A 7% sell-through rate. There is nothing wrong with the land on Treasure Island — the pricing consensus there is simply being set by a wall of asking prices that no buyer has agreed to yet.
Smaller areas — Key Largo, Bayview, Bridge Harbor — posted better sell-through rates, but on one to two sales apiece. Those are data points, not trends, and they should be read alongside the active listings rather than on their own.
Where the Unsold Inventory Actually Sits
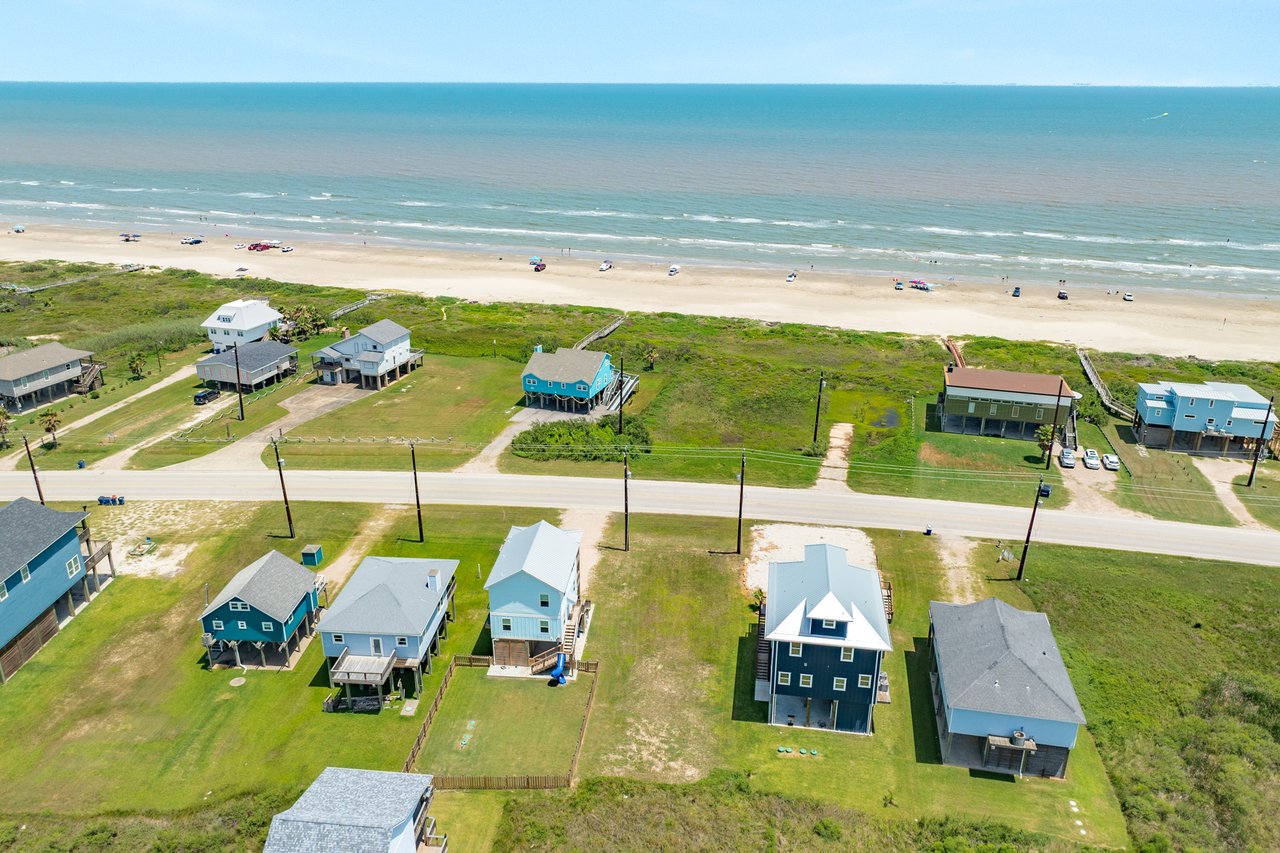
Using each listing's map coordinates measured across the island, shore to bay, the 91 active homesites break down by orientation like this. This indicates which side of the road a lot sits on — it is not a guarantee of beachfront, and any individual lot should be verified before it is marketed.
Position | Active | Median Asking | $ / Lot Sq Ft | Failed in 2026 |
|---|---|---|---|---|
Surfside · Beach Side | 6 | $184,950 | $26.70 | 2 |
Surfside · Interior | 28 | $186,200 | $22.30 | 9 |
Surfside · Bay / Canal Side | 5 | $44,950 | $2.25 | 4 |
Treasure Island · Beach Side | 5 | $84,500 | $16.90 | 0 |
Treasure Island · Interior | 11 | $104,700 | $19.78 | 10 |
Treasure Island · Bay / Canal Side | 10 | $90,000 | $15.07 | 3 |
Two things jump out. First, the interior is where the inventory is stacked — Surfside has 28 interior lots active against 6 on the beach side, and the interior accounted for 9 of Surfside's 16 failed listings. Second, the bay side is a different product entirely: those Surfside bay lots run around 20,000 square feet, several times a typical beach-side lot, which is why their per-foot number reads so low. Compare island lots per square foot, not per lot, or you will reach the wrong conclusion every single time.
Demand Is Real — The Middle Is Where Listings Die
Sales were spread more evenly across the price range than most people assume: 4 closings under $50,000, 3 from $50K to $100K, 3 from $100K to $200K, and 2 above that. Buyers show up at every price point on this island.
What changes by band is survival:
- Under $50,000 — 13 active, 26 months of supply. The fastest band on the island.
- $50,000–$100,000 — 22 active, 58.7 months of supply.
- $100,000–$200,000 — 32 active, 85.3 months of supply. The most crowded shelf.
- $200,000–$350,000 — 17 active, 68.0 months of supply.
- $350,000+ — 7 active, zero sales in 2026.
And here is the punchline: 24 of the 33 failed listings were priced between $50,000 and $200,000. There are simply far more sellers stacked in the middle of this market than the middle can absorb.
Large Tracts: One Acre and Up
Twenty tracts of an acre or more are currently listed across the island at a median asking price of $498,000. None sold in 2026, and eight tract listings expired or were withdrawn. Tracts are reported separately from homesites in our full report on purpose — an 18-acre tract and a 5,000-square-foot beach lot are not the same product, and blending them would quietly inflate every median.
With no closings to anchor against, every figure in the acreage market right now is an asking price, which is the weakest form of market evidence there is. Island acreage trades rarely, and when it does, the comparable set is small enough that no formula covers it.
If You Own Island Land: Three Things the Data Says
1. Six months on market is your warning light
The lots that sold averaged just over six months. The ones that failed averaged twelve. By the time a lot has been listed six months on this island, the market has already told you what it thinks. The sellers who adjust in month three are the ones in the sold column.
2. Price per square foot is the honest comparison
Your neighbor's asking price is not a comp — especially if their lot is a different size. Sold data at $12.12 per lot square foot is a comp. Asking data at $20.00 is a wish.
3. A 27% sell-through rate is not a reason to give your land away
Twelve lots sold in 2026 at prices from $22,500 to $325,000, and one of them closed at full list price. Well-positioned, correctly priced island land does move. The margin for error is just very thin, and the cost of getting it wrong is a year of your life and an expired listing.
If You're Buying Island Land: Where the Leverage Is
- Time is on your side. At 60.7 months of supply and 1.5 sales a month island-wide, nothing is going to be bought out from under you next week.
- The list price is an opening position. 2026 closings landed at a median of 83% of list.
- Days on market is your best negotiating data. Active island lots have been listed a median of 378 days. A seller at day 400 is in a very different frame of mind than one at day 30.
- Treasure Island and the Surfside interior hold the most motivated sellers — that is where the failed listings clustered, and expired listings are where re-negotiation conversations start.
- Do your homework on the lot itself. Buildability, utilities, elevation, setbacks, coastal construction requirements, insurance and flood zone status vary lot by lot on the island and must be verified independently.
Explore the Full Interactive 2026 Land Report
Every chart, every area, every price band — including an area-by-area explorer, listing-outcome breakdowns and the complete large-tract inventory — is in the full interactive report:
View the full 2026 Surfside Beach to Treasure Island Lot & Land Market Report →
Frequently Asked Questions
How many vacant lots sold in Surfside Beach and Treasure Island in 2026?
Twelve homesites under one acre closed in ZIP 77541 between January and August 2026 — about 1.5 sales per month island-wide. Surfside Beach accounted for 7, Key Largo 2, and Treasure Island, Bayview/Lazy Palms and Bridge Harbor 1 each.
What is the median price of a vacant lot on the island?
The median 2026 closing was $55,000, or $12.12 per lot square foot, with sales ranging from $22,500 to $325,000. Because that median rests on only twelve transactions — four of which closed on the same street on the same day — it should be treated as a reference point rather than a pricing benchmark.
Why won't my Surfside Beach or Treasure Island lot sell?
In 2026, only 27% of island lot listings ended in a sale. The listings that failed were asking a median of $115,000 against the $55,000 median that actually closed, and they sat a median of 365 days first. The most common cause is an asking price set from other asking prices rather than from closed sales.
How long does it take to sell a lot on the island?
Lots that sold in 2026 took a median of 200 days on market. Lots currently listed have been on market a median of 378 days, and the listings that expired or were withdrawn averaged 365 days before giving up.
Is now a good time to buy land in Surfside Beach or Treasure Island?
For buyers, the 2026 data shows unusual leverage: 60.7 months of supply, closings at a median of 83% of list price, and active listings averaging over a year on market. Buyers should still independently verify buildability, utilities, elevation, setbacks, coastal construction requirements, insurance and flood zone status for any specific lot.
What does "months of supply" mean for vacant land?
Months of supply is active inventory divided by the monthly sales pace. On housing, under 4 months is a seller's market. Land always runs higher because buyers are discretionary and financing is harder — under 12 months is fast for land, 12 to 24 is normal, and over 24 is a deep buyer's market. The island's 60.7 months is well beyond that.
What is your island lot actually worth today?
Not what the lot down the street is asking — what a buyer would pay for yours, on your block, at your size and orientation. I'll pull the closed comps, walk the lot, and give you a real number. No pressure, no pitch.
Get My Lot Valuation Call or Text 972-358-6420
Experience the Signature Difference
Cathy Carter is Broker and Founder of Carter Signature Properties, the Largest Brokerage on the Island, serving Surfside Beach, Treasure Island, San Luis Beach, Bridge Harbor, Bayview, Freeport and the Bluewater corridor across Brazoria County and the greater Houston and Galveston coast. 972-358-6420 · [email protected]
Data sourced from MLS for vacant land in ZIP 77541, covering closings recorded January 1 through August 31, 2026 — an eight-month window — together with listings active, expired or terminated as of the pull date. Headline statistics cover homesites under one acre; tracts of one acre or larger are reported separately. Four of the twelve closings were 4,125-square-foot lots on Surf Drive that all closed May 14, 2026, and are counted individually as recorded in MLS. Beach-side, interior and bay/canal-side classification is derived from each listing's MLS map coordinates measured across the island, not from an MLS beachfront field — it indicates orientation, not a guarantee of beachfront, and individual lots should be verified before marketing. Information deemed reliable but not guaranteed. This report is not an appraisal, a survey, a flood determination or a substitute for any of them. Market conditions change; individual results vary by lot, location and condition. Equal Housing Opportunity.